Transcription of UNIT # 1 - BASIC ECONOMIC CONCEPTS PLUS - Quia
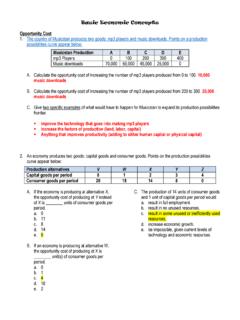
1 1. Use the axes below to draw the type of curve that illustrates the label above each axis . A. Increasing opportunity cost per unit of good B B. Constant opportunity cost per unit of Good B 2. * Answer the following questions based on the chart below : LIGHTHOUSE CPA SOCIAL SCIENCES DEPARTMENT AP ECONOMICS EXAM PREP WORKSHOP # 1 > BASIC ECONOMIC CONCEPTS NAME : DATE : B1 D1 C1 A1 X Y A B C A. Suppose there is a major technological breakthrough in the consumer goods industry , and the new technology is widely adopted . Which Curve in the diagram would represent the new production possibilities curve ? Indicate the curve you choose with two letters . B. Suppose a new government comes into power and imposes a significant tax on the use of automated machinery and modern production techniques in all industries.
2 Which curve in the diagram would represent the new production possibilities curve ?Indicate the curve you choose with two letters . C. Suppose massive new sources of oil and coal are found within the economy , and there are major technological innovation in both industries . Which curve in the diagram would represent the new production possibilities curve ? Indicate the curve you choose with two letters . D. If BB1 represents a country s current production possibilities curve , what can you say about a point like X ? Write a brief statement . E. If BB1 represents a country s current productin possibilities curve , what can you say about a point like Y ? Write a brief statement . 3. * Answer the following questions about Andy and Hannah based on the information given about the time it takes to clean an offices and jail cells : Andy Hannah Cleaning offices 60 minutes 20 minutes Cleaning jail cells 30 minutes 15 minutes A.
3 What is Andy s opportunity cost of cleaning offices in terms of cleaning jail cells ? B. What is Hannah s opportunity cost of cleaning offices in terms of cleaning jail cells ? C. What is Andy s opportunity cost of cleaning jail cells in terms of cleaning offices ? D. What is Hannah s opportunity cost of cleaning jail cells in terms of cleaning offices ? E. Who has the absolute advantage in cleaning offices ? F. Who has the absolute advantage in cleaning jail cells ? G. Who has the comparative advantage in cleaning offices ? H. Who has the comparative advantage in cleaning jail cells ? I. Who Should do which chore and why ? 4. Use the law of comparative advantage to explain why self sufficiency leads to a lower standard of living . 5. Other things held constant , which of the following would not cause a change in the demand for mopeds ? A. A decrease in consumer incomes B.
4 A decrease in the price of mopeds C. An increase in the price of bicycles , a substitute for mopeds D. An increase in people s tastes and preferences 6. * Rising oil prices have caused a sharp decrease in the demand for oil . Speaking precisely , and using terms as they are defined by economists , choose the statement that best describes this quotation : A. The quotation is correct : An increase in price always caused a decrease in demand . B. The quotation is incorrect : An increase in price always causes an increase in demand , not a decrease in demand . C. The quotation is incorrect : An increase in price causes a decrease in quantity demanded , not a decrease in demand . D. The quotation is incorrect : An increase in price causes and increase in the quantity demanded , not a decrease in demand . 7. * As the price of domestic automobiles has moved upward , customers have found foreign autos to be a better bargain.
5 Consequently , domestic auto sales have been decreasing , and foreign auto sales have been increasing . Using only the information in this quotation and assuming everything else constant , which of the following best describes this statement ? A. A shift in the demand curves for both domestic and foreign autos B. A movement along the demand curves for both foreign and domestic autos C. A movement along the demand curve for domestic autos , and a shift in the demand curve for foreign autos D. A shift in the demand curve for domestic autos , and a movement along the demand curve for foreign autos 8. You hear a fellow student say : ECONOMIC markets are like a perpetual see saw . If demand rises , the price rises ; if price rises , then demand will fall . If demand falls , price will fall ; if price falls , demand will rise and so non forever . Dispel your friend s obvious confusion in no more than on short paragraph.
6 9. Read the eight newspaper headlines below and use the table to record the impact , if any of each event on the demand for beef . Use the chart below to help you and always start at curve B . Move only one curve at a time . Beware that one headline implies that the demand for beef does not change . Dema Demand If Demand Curve Shifts New Headline Shift Y / N Shift Inc / Dec Left / Right Curve 1. Price of beef to rise next month B C A Quantity P r i c e 2. Millions of immigrants swell U. S. population 3. Pork prices drop 4. Surgeon General warns that eating beef is hazardous to health 5. Beef prices fall ; consumers buy more 6. Real income for the drops for the third straight month 7. Charcoal shortage threatens Memorial Day cookouts 8. Nationwide fad : The Disco burger In the section below , categorize each change in demand above to the reason why demand changed.
7 Place an X next to the reason that the event described in the headline caused a change in demand . One headline will have no answers because it is a change in quantity demanded . Reason Headline number 1 2 3 4 5 6 7 8 A change in consumer expectations A change in consumer tastes A change in the number of consumers in the market A change in income A change in the price of a substitute good A change in the price of a complementary good 10. * Other things constant , which of the following would not cause a change in the long run supply of beef / A. A decrease in the price of beef B. A decrease in the price of cattle food C. An increase in the price of cattle feed D. An increase in the cost of transporting cattle to market 11. * Falling oil prices have caused a sharp decrease in the supply of oil . Speaking precisely , and using terms as they are defined by economists , choose the statement that best describes this quotation : A.
8 The quote is correct : A decrease in price always causes a decrease in supply . B. The quote is incorrect : A decrease in price always causes an increase in supply , not a decrease in supply . C. The quote is incorrect : A decrease in price causes an increase in quantity supplied , not a decrease in supply . D. The quote is incorrect : A decrease in price causes a decrease in the quantity supplied , not a decrease in supply . 12. * A multiyear drought in Florida has dried the land so that rampant wildfires have destroyed many orange groves . Florida oranges supply much of the nation s orange juice . Which statement below is correct ? A. The price of orange juice will rise because of a movement up the supply curve . B. The price of orange juice will rise because the supply curve will shift to the left . C. The price of orange juice will fall because of a movement down the supply curve.
9 D. The price of orange juice will fall because the supply curve will shift to the right . 13. * A popular move star wears a certain style of sunglasses . If her fans want to copy her look : A. The price of the movie star s brand of sunglasses will rise because of a movement up the supply curve . B. The price of the movie star s brand of sunglasses will rise because the supply curve will shift to the left . C. The price of the movie star s brand of sunglasses will fall because of a movement down the supply curve . D. The price of the movie star s brand of sunglasses will fall because the supply curve will shift to the right . 14. Read the eight newspaper headlines below and use the table to record the impact , if any of each event on the supply of cars . Use the chart below to help you and always start at curve B.
10 Move only one curve at a time . Beware that two headlines imply that the supply of cars does not change . Supply If Supply Curve Shifts New Headline Shift Y / N Shift Inc / Dec Left / Right Curve 1. Auto Workers Union Agrees to Quantity P r i c e B A C Wage Cuts 2. New Robot Technology Increases Efficiency 3. Nationwide Auto Strike Began at Midnight 4. New Import Quotas Reduce Foreign Car Imports 5. Cost of Steel Rises 6. Auto Producer Goes Bankrupt ; Closes Operations 7. Buyers Reject New Models 8. National Income Rises 2 % In the section below , categorize each change in supply above to the reason why supply changed . Place an X next to the reason that the event described in the headline caused a change in supply . Two headlines do not indicate a shift in supply . Reason Headline number 1 2 3 4 5 6 7 8 A change in costs of inputs to production process A change in technology A change in the number of producers in the market Government policies 15.

