Transcription of United States Department of Agriculture Foreign ...
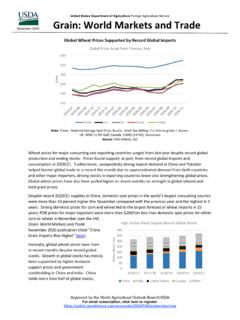
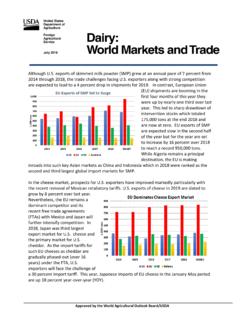
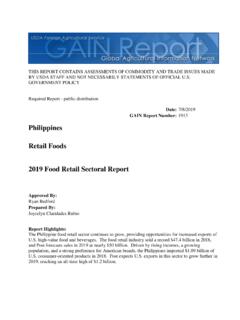
1 United States Department of Agriculture Foreign Agricultural Service September 2019. Grain: world Markets and trade Large Global Barley Production Drives Prices Down Barley harvest is largely complete for Northern Global Barley Production to Rise Hemisphere countries. Crops for Canada, the European 160. Million tons Union, Russia, and Ukraine are 150. larger than a year ago, contributing to sharply higher 140. global production for 2019/20, the largest since 2008/09. 130. Harvest in the Southern Hemisphere countries, mainly 120. Argentina and Australia, is still a few months away, although 110. Australia's prospects are 100.
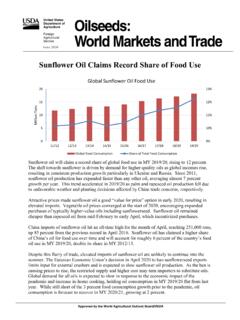
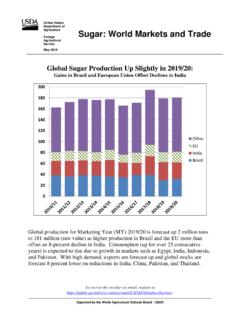
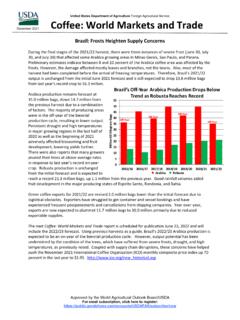
2 Lowered this month. Prospects 2014/15 2015/16 2016/17 2017/18 2018/19 2019/20. of large exportable supplies have already driven export prices down 25 percent ($60 per ton) from a year ago. Note the high prices for Australia are likely a function of current crop expectations. Growth in import demand, nevertheless, is expected to be limited due to developments in the top importing countries. Saudi Arabia has been shifting away from feeding raw barley to using manufactured feed in feed rations to improve Barley Export Prices ($ per ton). feed efficiency. China's 330. imports from its top supplier, 310.
3 Australia, have slowed down 290. 270. amid the ongoing antidumping 250. investigation. Any growth in 230. feed use in China will likely be 210. 190. constrained by animal losses 170. from African Swine Fever. 150. 4/2/2018. 5/2/2018. 6/2/2018. 7/2/2018. 8/2/2018. 9/2/2018. 10/2/2018. 11/2/2018. 12/2/2018. 1/2/2019. 2/2/2019. 3/2/2019. 4/2/2019. 5/2/2019. 6/2/2019. 7/2/2019. 8/2/2019. 9/2/2019. Saudi Arabia and China combined account for 60. percent of global barley imports. Argentina Feed Australia Feed, Adelaide Black Sea Feed EU Feed, Hamburg Moreover, abundant supplies of corn in the global market will also heighten competition in feed demand, as corn is priced much lower than feed barley and generally considered to be of higher energy value in feed rations.
4 Approved by the world Agricultural Outlook Board/USDA. For email subscription, click here to register: COARSE GRAINS. OVERVIEW FOR 2019/20. Global corn production is forecast down with smaller crops for the United States and Ukraine. Global trade is little changed from last month. The season-average farm price is unchanged at $ per bushel. OVERVIEW FOR 2018/19. Global corn production is slightly lower this month driven by India and Paraguay. Global trade is up with higher imports for the European Union and Iran more than offsetting lower imports by Mexico. For exports, Brazil is up reflecting record shipments in August.
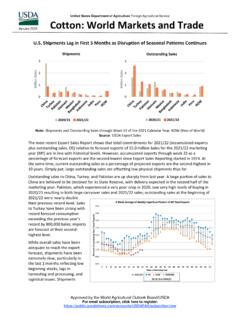
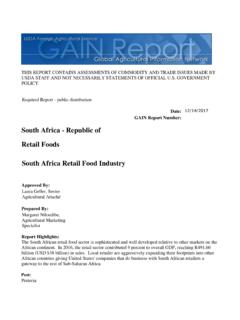
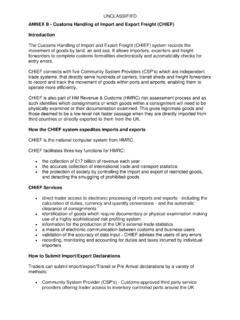
5 Exports are cut based on sales and shipments observed through early September. The season-average farm price is unchanged at $ per bushel. CORN PRICES. Global: Since the August WASDE, major exporters' bids have all dropped, reflecting abundant supplies. Argentine bids are down $23/ton to $140 and Brazilian bids are down $21/ton to $151. Black Sea bids have fallen $32/ton to $155. bids have dropped $29/ton to $156 as sales and shipments remain weak in the face of strong competition. Although forecast greater exportable supplies have depressed prices, the spread against Brazilian bids has narrowed from last month with the approach of harvest in the United States .
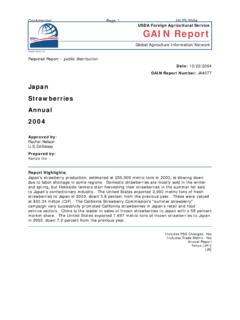
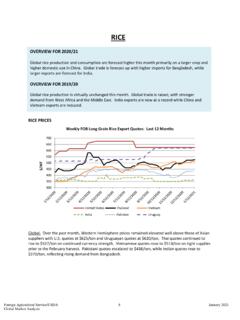
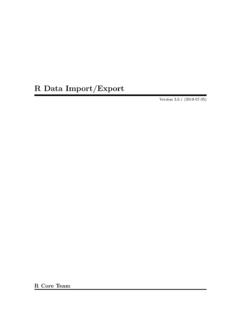
6 Selected Export Bids 210. 200. 190. 180. $/MT. 170. 160. 150. 140. 130. Argentina Brazil US Black Sea Source: IGC. Foreign Agricultural Service/USDA 11 September 2019. Office of Global Analysis market FEATURE. China's Sorghum and Barley Balance Sheet Revised Combined Sorghum and Barley Production Combined Sorghum and Barley Consumption 6 25. MMT. MMT. 5 20. 4. 15. 3. 10. 2. 5. 1. 0 0. NEW OLD NEW OLD. This month, China's Supply and Demand balance sheets for sorghum and barley are revised to incorporate the revisions by China's National Bureau of Statistics (NBS). In August, the NBS released revised area, yield, and production estimates for sorghum and barley from 2007/08 through 2017/18 based on its most recent agricultural census.
7 For sorghum, the NBS revision takes away a cumulative million tons in production for the 10-year period. For barley, the revision removes a cumulative million tons in production for the period. With substantial reductions in supply, total consumption in both categories - food, seed, industrial use as well as feed and residual use - are adjusted slightly lower, reflecting relatively strong demand at the time. Ending stocks fall lower on smaller production and this relatively strong use. The magnitude of the revision appears significant for both sorghum and barley. However, the revision has little impact on supply and use for coarse grains (corn, barley, sorghum, oats, and rye) because corn is the largest and most commonly produced and used crop.
8 Sorghum and barley combined account for only about 2. percent of coarse grain production and 5 percent of coarse grain use. Foreign Agricultural Service/USDA 12 September 2019. Office of Global Analysis trade CHANGES IN 2019/20 (1,000 MT). Country Commodity Attribute Previous Current Change Reason Australia Barley Exports 5,000 4,500 -500 Smaller crop Smaller shipments in Canada Oats Exports 2,000 1,800 -200. July and August Expected purchases Iran Barley Imports 3,000 3,200 200. from Kazakhstan Kazakhstan Barley Exports 1,600 1,800 200 Larger crop Russia Barley Exports 5,400 5,600 200 Larger crop Ukraine Barley Exports 4,400 4,800 400 Larger crop trade CHANGES IN 2018/19 (1,000 MT).
9 Country Commodity Attribute Previous Current Change Reason Record August Brazil Corn Exports 37,500 39,500 2,000 shipments at competitive prices European Corn Imports 23,500 24,000 500 trade to date Union Barley Imports 150 450 300 trade to date Reflects large Iran Corn Imports 9,500 10,000 500. purchases from Brazil Mexico Corn Imports 17,000 16,700 -300 trade to date Smaller- than- United States Corn Exports 51,000 50,500 -500 anticipated August inspections data Foreign Agricultural Service/USDA 13 September 2019. Office of Global Analysis ENDNOTES. REGIONAL TABLES. North America: Canada, Mexico, the United States Central America: Belize, Costa Rica, El Salvador, Guatemala, Honduras, Nicaragua, Panama Caribbean: Anguilla, Antigua and Barbuda, Aruba, Bahamas, Barbados, Bermuda, British Virgin Islands, Cayman Islands, Cuba, Dominica, Dominican Republic, French West Indies, Grenada, Guadeloupe, Haiti, Jamaica and Dep, Leeward-Windward Islands, Martinique, Montserrat, Netherlands Antilles, Puerto Rico, Kitts and Nevis, St.
10 Lucia, St. Vincent and the Grenadines, Trinidad and Tobago, Turks and Caicos Islands, Virgin Islands South America: Argentina, Bolivia, Brazil, Chile, Colombia, Ecuador, Falkland Islands (Islas Malvinas), French Guiana, Guyana, Paraguay, Peru, Suriname, Uruguay, Venezuela EU: Austria, Belgium/Luxembourg, Bulgaria, Croatia, Cyprus, Czech Republic, Denmark, Estonia, Finland, France, Germany, Greece, Hungary, Ireland, Italy, Latvia, Lithuania, Malta, Netherlands, Poland, Portugal, Romania, Slovakia, Slovenia, Spain, Sweden, United Kingdom Other Europe: Albania, Azores, Bosnia and Herzegovina, Former Yugoslavia, Gibraltar, Iceland, Macedonia, Montenegro, Norway, Serbia, Switzerland Former Soviet Union: Armenia, Azerbaijan, Belarus, Georgia, Kazakhstan, Kyrgyzstan, Moldova, Russia, Tajikistan, Turkmenistan, Ukraine, Uzbekistan Middle East: Bahrain, Iran, Iraq, Israel, Jordan, Kuwait, Lebanon, Oman, Qatar, Saudi Arabia, Syria, Turkey, United Arab Emirates, Yemen North Africa: Algeria, Egypt, Libya, Morocco, Tunisia Sub-Saharan Africa: all African countries except North Africa East Asia.