Transcription of User-friendly Data for Magnetic Core Loss Calculations
1 User-friendly Data for Magnetic core Loss Calculations Edward Herbert, Canton, CT. November 10, 2008. Introduction: operate with square-waves having a variable duty-cycle. (4) The graphs are Everyone "knows" that) core losses notoriously inaccurate. It is not unusual depend only upon B and frequency. It to see ruler-straight lines on core loss does not matter what the excitation level curves, with gross inaccuracies at the and duty-cycle extremes. ) is, only the maximum flux density B . That is true, if the switching frequency is below 10 kHz or Some very interesting work has been so. At the frequencies used in today's done exploring losses at increased pulse-width-modulated (pwm) "effective frequency." [1], [2] and [3]. transformers, the core losses increase dramatically for low duty-cycles, as Using volt-second graphs much as 10 times at 10 % duty-cycle.
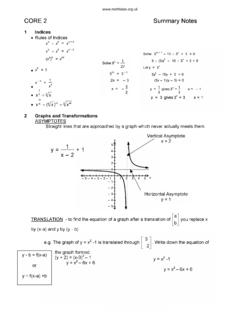
2 Figure 1 shows representative core loss Graphs of Magnetic core loss data are curves for square-wave excitation, usually for sine-wave excitation and presented as a family of constant voltage presented) in terms of maximum flux curves vs. pulse-width t. density B and frequency f. These graphs are of questionable value for pulse- width-modulated (pwm) power converter design and decidedly not user- friendly. Graphs of core loss data for square-wave excitation, presented in terms of applied voltage and time are much more relevant to pwm power converter design and are much easier to use. Background: Magnetic core loss graphs from manufacturers are marginally useful for pwm power converter design. (1) They usually present loss in terms ) of maximum flux density B , an unfamiliar parameter of little use to the power converter designer.
3 (2) The Magnetic units used for core loss graphs are confusing and inconsistent. The likelihood of making errors is Figure 1: Representative core loss curves for significant. (3) The graphs are for sine- constant voltage square-wave excitation vs. wave excitation. Most pwm converters pulse-width. 1. For a graph for a Magnetic material, Note that at short pulse-widths (high material, the voltage is normalized and frequency), the losses rise significantly has units of volts per area-turn and the at low duty-cycle. At longer pulse- loss is in watts per volume. core loss widths, (low frequency), the duty-cycle graphs for specific cores can include the does not much affect losses. This latter geometric parameters, so the units are case is the classic loss characteristic volts/turn and watts. taught for Magnetic design.
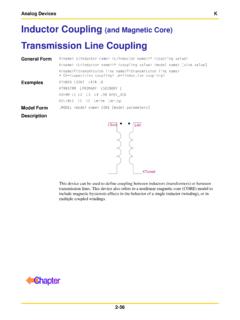
4 Low duty-cycle data The reader is advised that these curves were derived using Steinmetz equations applied far beyond their limits of reasonable accuracy, using many complex manipulations, each an opportunity for error. Accordingly, the graphs are qualitative at best. However, the graphs represent a suggested form to use for plotting "real". data, from laboratory test and measurement. Real data from real tests will always trump manipulated data and Figure 2. Curves of constant average voltage can be plotted. Note the extreme change in slope approximations. for short pulse widths (high frequency). This presentation of the data is user- In figure 2, curves of constant average friendly and much more meaningful for voltage equal to V were plotted for power converter design. several frequencies. As an example, using the technique for low duty-cycles presented below, start with the V line and ms, point A.
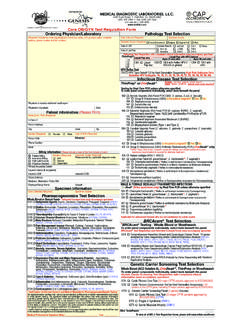
5 That is the loss for a square wave with ms pulse width. At ms, to have the same average voltage, the voltage during the pulse is V, point B, reduced by the duty-cycle , point C. The line A-C is approximately the line showing the loss for constant average voltage. This may be the most useful curve of all for a power converter designer. The same technique is repeated to estimate the losses at constant average voltage for other starting pulse-widths (frequencies), resulting in a family of curves, shown in figure 2. Figure 3: Times and duty-cycles defined. 2. Calculations Next, follow the dashed line up from 4. us to intercept the volt curve, then See figure 3 to define pulse-width and horizontally to intercept the vertical axis. duty-cycle: In all cases, the pulses are The result is multiplied by the duty-cycle repetitive steady-state pulses, as would of to give about mw/cm3.
6 Add be generated in a pwm converter at the partial results. The core loss is about stead-state conditions. mw/cm3. For a square-wave excitation, t is the Thus a method of calculating core loss is pulse-width and T is the period. The presented that does not require duty-cycle D is To calculate the calculating Magnetic parameters. This core losses using figure 1 for a 1 volt data and the Calculations are much more square-wave with a pulse-width of 2 us, relevant to power converter design, and follow the dashed line up from 2 us to much more User-friendly . intercept the 1 volt curve, then horizontally to intercept the vertical axis. Saturation The result is about mw/cm3. Following the constant voltage curves For a symmetrical pulsed excitation, t from left to right, the volt-seconds of is the pulse-width and T is the period.
7 Each point is the product of the voltage The duty-cycle D is 2 * t / T. To and the pulse-width. The curve ends at calculate the core loss for a 1 volt pwm the volts-seconds where the core wave-form having a 1 volt excitation and saturates. Accordingly, as long as the a 2 us pulse-width and a duty-cycle of voltage and pulse-widths of interest are , follow the dashed line up from 2 us on the curve, the core will not saturate to intercept the 1 volt curve, then (if there is no flux walking.). horizontally to intercept the vertical axis. The result is multiplied by the duty-cycle Loss data for cores and to give about mw/cm3. wound components For an asymmetrical pulsed excitation, the volt-seconds none-the- less must be equal for the pulses. T is the period, t1 is the positive pulse-width, t2 is the negative pulse-width.
8 Two duty-cycles are defined, D1 = t1 / T and D2 = t2 / T. To calculate the core loss for an asymmetrical pwm having a period of 8. us, and having a 2 us positive pulse of 1. Figure 4. For a specific core , the geometric volt and a 4 us negative pulse of volt, parameters can be included, so the result is read first follow the dashed line up from 2 us directly as watts W. to intercept the 1 volt curve, then horizontally to intercept the vertical axis. Losses for cores: A manufacturer of The result is multiplied by the duty-cycle Magnetic cores can present data for any of to give about mw/cm3. specific core with all of the geometric 3. parameters included, so the user need For any expression using frequency, an not be concerned with effective area, equivalent expression can substitute the effective volume and the like.
9 Knowing inverse of the period, noting that the volts/turn and the pulse-widths of frequency f equals 1 / T, where T is the interest, the losses in the core can be period. We prefer using the half-cycle read directly from the graph, as seen in period t, so f equals 1 / 2 t. Figure 4. Steinmetz equation using Losses for wound components: A voltage v and the period T. similar graphical presentation includes the turns, allowing a designer to The Steinmetz equation (or any other ). determine the core losses directly using expression using B and f) can be only the voltage and pulse-widths. expressed in terms of voltage and time. ). "Remagnetization velocity" Pv = C m * f * B . Many papers have suggested that dB/dt Substituting ) f=1/T. and B are more relevant to core loss, and B = k * v * T gives leading to improved methods of calculation that have a better match to.
10 1 . test data. None, as far as we know, has Pv = Cm * * (k * v * T ) . recognized dB/dt as voltage (with a scale T . factor). Yet, for most power converter Pv = Cm * v * T ( ). designers, voltage is a much easier parameter to use and understand. [T is the period, k is the scale) factor converting volt-seconds to B , v is the All continue ) to use maximum flux voltage density and C'm = Cm * k .]. density B and frequency f. [1] uses the term "remagnetization velocity" for This exercise is to demonstrate the dB/dt. In [2] and [3], the more equivalence of the expressions, not to straightforward "dB/dt" is used. suggest converting present data to the new format, particularly as we prefer For any expression using the flux) density using square-wave excitation. New data B or the maximum flux density B , an should be taken using voltage and pulse- equivalent expression can be written width.