Transcription of Vanguard Energy ETF VDE
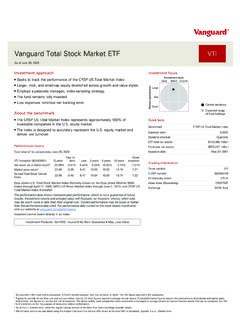
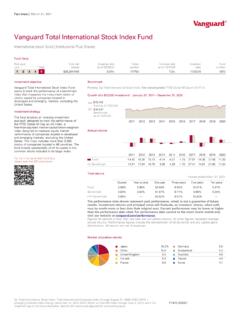
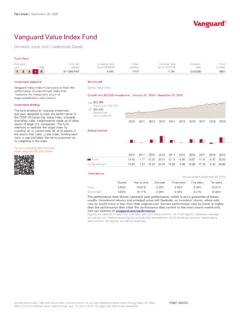
1 Vanguard Vanguard Energy ETF | VDE As of March 31, 2023 Investment approach Seeks to track the performance of the MSCI US Investable Market Energy 25/50 Index. Multicapitalization equity in the Energy sector . Employs a passively managed, full-replication strategy when possible. If regulatory constraints prevent full replication, the fund uses a sampling strategy to approximate the index s key characteristics. The fund remains fully invested. Low expenses minimize net tracking error. About the benchmark The MSCI US Investable Market Energy 25/50 Index includes stocks of companies within the Energy sector . The sector is made up of companies whose businesses are dominated by either of the following activities: the construction or provision of oil rigs, drilling equipment, and other Energy -related service and equipment; or the exploration, production, marketing, refining, and/or transportation of oil and gas products.
2 Uses gics methodology and clearly classified sectors. Offers broad representation of the target sector across large-, medium-, and small-cap companies. Performance history Total returns 2 for period ended March 31, 2023 VDE (Inception 09/23/2004) Quarter Year to date 1 year 3 years 5 years 10 years Since inception Net asset value (NAV) return Market price return Spliced Investable Market Energy 25/50 Index MSCI US Investable Market Energy Index through February 26, 2010; MSCI US Investable Market Energy 25/50 Index thereafter. The performance data shown represent past performance, which is not a guarantee of future results. Investment returns and principal value will fluctuate, so investors shares, when sold, may be worth more or less than their original cost. Current performance may be lower or higher than the performance data cited. For performance data current to the most recent month-end, visit our website at.
3 The performance of an index is not an exact representation of any particular investment, as you cannot invest directly in an index. Investment Products: Not FDIC Insured No Bank Guarantee May Lose Value Quick facts Benchmark MSCI US IMI/ Energy 25/50 Expense ratio Dividend schedule Quarterly ETF total net assets $7,658 million Fund total net assets $9,583 million Inception date September 23, 2004 Trading information Ticker symbol VDE CUSIP number 92204A306 IIV (intra-day ticker) Index ticker (Bloomberg) M5US5 ENI Exchange NYSE Arca ETF attributes Energy ETF MSCI US IMI/ Energy 25/50 Number of stocks 112 112 Median market cap $ $ Price/earnings ratio Price/book ratio Return on equity Earnings growth rate Turnover rate Standard deviation 6 1. As reported in the most recent prospectus. A fund s current expense ratio may be lower or higher than the figure reported in the prospectus. 2. Figures for periods of less than one year are cumulative returns.
4 All other figures represent average annual returns. Fund performance figures assume the reinvestment of dividends and capital gains distributions; the figures are pre-tax and net of expenses. The above widely used comparative index represents unmanaged or average returns on various financial assets that can be compared with the fund s total returns for the purpose of measuring relative performance. 3. As of 4 , Eastern time, when the regular trading session of the New York Stock Exchange typically closes. 4. Market price returns are calculated using the midpoint between the bid and offer prices at the time NAV is calculated, typically 4 , Eastern time. 5. For most recent fiscal year. Turnover rate excludes the value of portfolio securities received or delivered as a result of in-kind purchases or redemptions of the fund s capital shares, including Vanguard ETF Creation Units. 6. A measure of the volatility of a fund based on the fund s last three years of monthly returns used to indicate the dispersion of past returns.
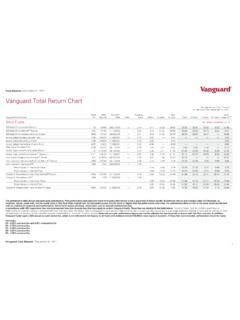
5 A higher standard deviation means a greater potential for volatility. For funds with less than 36 months of performance history, standard deviation is not calculated. Vanguard Energy ETF | VDE As of March 31, 2023 Expense ratio comparison 1 Natural Resources Funds Average Natural Resources Fds Avg ETFs only Energy ETF Ten largest holdings and % of total net assets 2 Exxon Mobil Corp. %Chevron Corp. %ConocoPhillips %Marathon Petroleum Corp. %Schlumberger NV %EOG Resources Inc. %Occidental Petroleum Corp. %Valero Energy Corp. %Phillips 66 %Pioneer Natural Resources Co. %Top ten as %of total net assets Market capitalization breakdown Large Cap %Medium/Large Cap %Medium Cap %Medium/Small Cap %Small Cap %Subindustry diversification as %of common stock 3 Integrated Oil & Gas %Oil & Gas Exploration & Production %Oil & Gas Refining & Marketing %Oil & Gas Storage & Transportation %Oil & Gas Equipment & Services %Oil & Gas Drilling %Coal & Consumable Fuels %1.
6 Represents the expense ratio for the Vanguard ETF as reported in the most recent prospectus. There are material differences between mutual funds and ETFs. Unlike mutual funds, ETFs are priced continuously and bought and sold throughout the day in the secondary market (at a premium or discount to net asset value) with the assistance of a stockbroker, which entails paying commissions. Sources: Lipper, a Thomson Reuters Company, and Vanguard , December 31, 2022. 2. The holdings listed exclude any temporary cash investments and equity index products. 3. sector categories are based on the Global Industry Classification Standard ( gics ), except for the Other category (if applicable), which includes securities that have not been provided a gics classification as of the effective reporting period. Beginning March 2023, the structure of various gics Sectors, Industry Groups, Industries and Sub-Industries are being revised.
7 Please note that there may be differences in certain gics names, classifications, and portfolio weights relative to the benchmark as these changes are implemented across the industry, with MSCI expecting to complete their changes by May 2023. Vanguard ETF Shares are not redeemable with the issuing Fund other than in very large aggregations worth millions of dollars. Instead, investors must buy or sell Vanguard ETF Shares in the secondary market and hold those shares in a brokerage account. In doing so, the investor may incur brokerage commissions and may pay more than net asset value when buying and receive less than net asset value when selling. All ETF products are subject to risk, which may result in the loss of principal. sector ETF products are subject to sector risks and non-diversification risks, which may result in performance fluctuations that are more extreme than fluctuations in the overall stock market.
8 The funds or securities referred to herein are not sponsored, endorsed, or promoted by MSCI, and MSCI bears no liability with respect to any such funds or securities. The prospectus or the Statement of Additional Information contains a more detailed description of the limited relationship MSCI has with Vanguard and any related funds. CGS identifiers have been provided by CUSIP Global Services, managed on behalf of the American Bankers Association by Standard & Poor s Financial Services, LLC, and are not for use or dissemination in a manner that would serve as a substitute for any CUSIP service. The CUSIP Database, 2023 American Bankers Association. CUSIP is a registered trademark of the American Bankers Association. For more information about Vanguard ETF Shares, visit , call 866-499-8473, or contact your broker to obtain a prospectus or, if available, a summary prospectus. Investment objectives, risks, charges, expenses, and other important information are contained in the prospectus; read and consider it carefully before investing.
9 2023 The Vanguard Group, Inc. All rights reserved. Patent No. 6,879,964. Vanguard Marketing Corporation, Distributor. FA0951_0323