Transcription of VIBRATIONAL SPECTROSCOPY
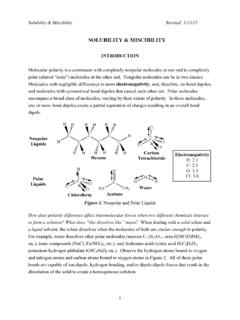
1 Reading: VIBRATIONAL SPECTROSCOPY Revised: 2/24/15. VIBRATIONAL SPECTROSCOPY . SPECTROSCOPY techniques are often employed in the characterization of molecules and chemical reactions. SPECTROSCOPY probes for chemical information by exposing a chemical species to particular energies of electromagnetic radiation and observing the radiation transmitted through or reflected from that matter. You are already familiar with visible SPECTROSCOPY . Radiation from the visible part of the electromagnetic spectrum interacts with a chemical species to cause an electron to move from its ground state (GS) to a much higher energy orbital (an electronic excitation state (EE)).
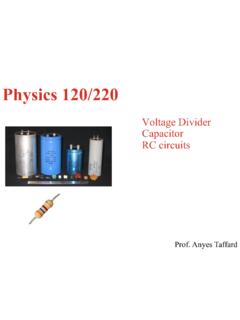
2 Radiation corresponding to this electron transition is absorbed, creating a peak at a corresponding energy (wavelength) in the absorbance spectrum. (Recall: E = hc/ ). Figure 1: electronic Excitation Diagram. VIBRATIONAL spectroscopic methods use infrared or near infrared (the low energy end of the visible spectrum) to create vibrations (bond stretching or bending) in chemical species. Like visible SPECTROSCOPY , the radiation causing the vibration is absorbed and a corresponding peak is created on an Infrared or Raman spectrum. In Figure 2, the electronic ground state is again represented by GS and electronic excitation states are represented by EE.
3 VIBRATIONAL excitation states are found at energy levels in between, notated by VE in the figure. The VIBRATIONAL excitation states are lower in energy than electronic excitation states. Figure 2: VIBRATIONAL Excitation Diagram. GS denotes the ground state of an electron, VE is a VIBRATIONAL excitation state, and EE is an electronic excitation state Reading: VIBRATIONAL SPECTROSCOPY Revised: 2/24/15. The most widely used VIBRATIONAL SPECTROSCOPY is Infrared (IR) SPECTROSCOPY . In IR. SPECTROSCOPY , an infrared lamp produces electromagnetic radiation between the wavelengths of 700 nm to 1 mm.
4 Converting wavelength to frequency ( 1/ ), is convenient for this type of SPECTROSCOPY because VIBRATIONAL excitations occur at characteristic frequencies in molecules. When a spectrum of a chemical is taken, the spectrometer scans through a range of wavelengths (frequencies). Electromagnetic interference is used to expose the sample with one wavelength (frequency) at a time. This concept will be further clarified in the description of IR. spectrometers below. When a chemical sample is exposed to electromagnetic radiation at the right frequency, the atoms of the chemical vibrate at that frequency, resulting in the stretching of bond lengths and angles.
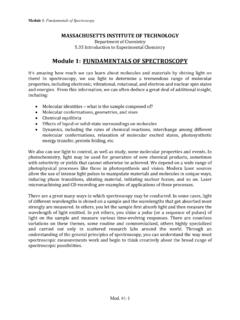
5 This concept is shown in Figure 3. The bond is analogous to a spring: when the bond is compressed or stretched an equal and opposing spring force is induced. This spring force is denoted by the Hooke's law equation: F = kx (1). Where F is the spring force of the bond, k is the spring constant, and x is the distance between atomic nuclei. Equilibrium Bond Length Spring Force Stretched Bond Spring Force Compressed Bond Figure 3: VIBRATIONAL Stretching Mechanisms The detector measures the reduction of the frequency of the electromagnetic radiation absorbed by the chemical sample, resulting in a peak on the spectrum.
6 This peak occurs at this frequency due to the stretching and compressing of bonds in a molecule. Reading: VIBRATIONAL SPECTROSCOPY Revised: 2/24/15. Figure 4: IR VIBRATIONAL Excitation Energy Diagram. As shown in Figure 4, the energy states in the excitation diagram are labeled as GS (ground state), VE ( VIBRATIONAL excitation), and EE ( electronic excitation) for simplicity. The ground state (GS) is the same as the highest occupied molecular orbital (HOMO) and the excited state (EE) is the same as the lowest unoccupied molecular orbital (LUMO). The energy of VIBRATIONAL excitation states is found somewhere in between these orbitals.
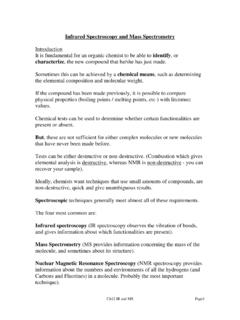
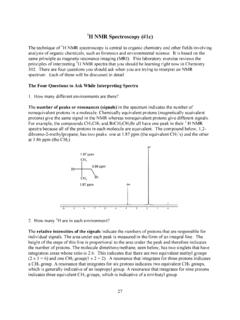
7 To monitor VIBRATIONAL excitations in a molecule, a Fourier Transform Infrared (FTIR). Spectrometer is most often used. The design of this instrument is shown in Figure 5. The excitation source is an IR lamp capable of emitting many wavelengths of radiation. Figure 3: Instrumental Design of a FTIR spectrometer. Reading: VIBRATIONAL SPECTROSCOPY Revised: 2/24/15. First, the radiation passes through a collimator to ensure the photons are all moving in the same direction, eliminating scattering. The radiation then enters a beam splitter and is separated into two beams.
8 One beam is redirected at a 90 angle to a stationary mirror; the other is sent to an automated moving mirror. A time delay is created between the beams resulting in destructive interference between the two paths at certain wavelengths. As a result, only photons of a single wavelength reach the sample each time for excitation. To change the wavelength of the photons, the moving mirror is adjusted causing the interference to occur at the desired wavelength. By continually adjusting the moving mirror, the instrument can scan through the entire IR. wavelength range to create a spectrum.
9 The spectrum created is with respect to time. A Fourier transform (a mathematical operation that converts time to frequency) is performed to give spectral peak positions in wavenumbers (cm-1), a frequency unit. Now that the basics of IR SPECTROSCOPY have been covered, let's examine what happens at a more detailed level. As you know, a molecule is often composed of several different atoms bound to each other covalently. Each bond type in a molecule can be excited at a characteristic frequency. Table 1 contains some common VIBRATIONAL mode frequencies for different bond types.
10 When a bond in a molecule is vibrationally excited, a peak appears on the spectrum representing the absorption of energy at that frequency. Bond strength is directly related to frequency. In other words, more energy (a higher frequency) is required to vibrate a stronger bond. Because of this relationship, IR SPECTROSCOPY is typically used to show the presence of certain bonding types. Bond Expected Frequency Range Intensity Type of peak ( , cm-1) (Peak Size). O-H 3200-3700 strong C-O 1050-1150 strong C=O 1670-1820 strong C-H 2850-3100 medium C=C 1620-1680 variable C C 2100-2260 variable C-N 1250-1335 medium C=N 2100-2270 medium C N 2210-2260 medium S-C 570-710 weak S=C 1030-1200 strong Table 1: Stretching Frequencies of Common Bonds Absorption of IR radiation leads to the VIBRATIONAL excitation of an electron.