Transcription of VIBRATIONAL SPECTROSCOPY
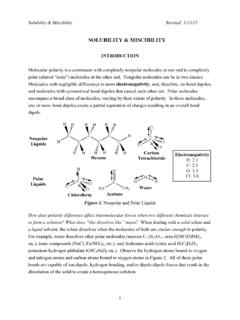
1 Reading: VIBRATIONAL SPECTROSCOPY Revised: 2/24/15. VIBRATIONAL SPECTROSCOPY . SPECTROSCOPY techniques are often employed in the characterization of molecules and chemical reactions. SPECTROSCOPY probes for chemical information by exposing a chemical species to particular energies of electromagnetic radiation and observing the radiation transmitted through or reflected from that matter. You are already familiar with visible SPECTROSCOPY . Radiation from the visible part of the electromagnetic spectrum interacts with a chemical species to cause an electron to move from its ground state (GS) to a much higher energy orbital (an electronic excitation state (EE)). Radiation corresponding to this electron transition is absorbed, creating a peak at a corresponding energy (wavelength) in the absorbance spectrum. (Recall: E = hc/ ). Figure 1: Electronic Excitation Diagram. VIBRATIONAL spectroscopic methods use infrared or near infrared (the low energy end of the visible spectrum) to create vibrations (bond stretching or bending) in chemical species.
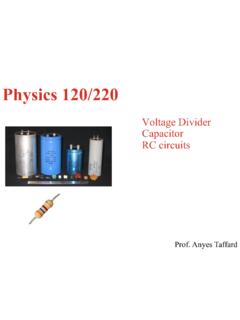
2 Like visible SPECTROSCOPY , the radiation causing the vibration is absorbed and a corresponding peak is created on an Infrared or Raman spectrum. In Figure 2, the electronic ground state is again represented by GS and electronic excitation states are represented by EE. VIBRATIONAL excitation states are found at energy levels in between, notated by VE in the figure. The VIBRATIONAL excitation states are lower in energy than electronic excitation states. Figure 2: VIBRATIONAL Excitation Diagram. GS denotes the ground state of an electron, VE is a VIBRATIONAL excitation state, and EE is an electronic excitation state Reading: VIBRATIONAL SPECTROSCOPY Revised: 2/24/15. The most widely used VIBRATIONAL SPECTROSCOPY is Infrared (IR) SPECTROSCOPY . In IR. SPECTROSCOPY , an infrared lamp produces electromagnetic radiation between the wavelengths of 700 nm to 1 mm. Converting wavelength to frequency ( 1/ ), is convenient for this type of SPECTROSCOPY because VIBRATIONAL excitations occur at characteristic frequencies in molecules.
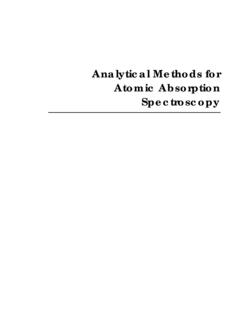
3 When a spectrum of a chemical is taken, the spectrometer scans through a range of wavelengths (frequencies). Electromagnetic interference is used to expose the sample with one wavelength (frequency) at a time. This concept will be further clarified in the description of IR. spectrometers below. When a chemical sample is exposed to electromagnetic radiation at the right frequency, the atoms of the chemical vibrate at that frequency, resulting in the stretching of bond lengths and angles. This concept is shown in Figure 3. The bond is analogous to a spring: when the bond is compressed or stretched an equal and opposing spring force is induced. This spring force is denoted by the Hooke's law equation: F = kx (1). Where F is the spring force of the bond, k is the spring constant, and x is the distance between atomic nuclei. Equilibrium Bond Length Spring Force Stretched Bond Spring Force Compressed Bond Figure 3: VIBRATIONAL Stretching Mechanisms The detector measures the reduction of the frequency of the electromagnetic radiation absorbed by the chemical sample, resulting in a peak on the spectrum.
4 This peak occurs at this frequency due to the stretching and compressing of bonds in a molecule. Reading: VIBRATIONAL SPECTROSCOPY Revised: 2/24/15. Figure 4: IR VIBRATIONAL Excitation Energy Diagram. As shown in Figure 4, the energy states in the excitation diagram are labeled as GS (ground state), VE ( VIBRATIONAL excitation), and EE (electronic excitation) for simplicity. The ground state (GS) is the same as the highest occupied molecular orbital (HOMO) and the excited state (EE) is the same as the lowest unoccupied molecular orbital (LUMO). The energy of VIBRATIONAL excitation states is found somewhere in between these orbitals. To monitor VIBRATIONAL excitations in a molecule, a Fourier Transform Infrared (FTIR). Spectrometer is most often used. The design of this instrument is shown in Figure 5. The excitation source is an IR lamp capable of emitting many wavelengths of radiation. Figure 3: Instrumental Design of a FTIR spectrometer.
5 Reading: VIBRATIONAL SPECTROSCOPY Revised: 2/24/15. First, the radiation passes through a collimator to ensure the photons are all moving in the same direction, eliminating scattering. The radiation then enters a beam splitter and is separated into two beams. One beam is redirected at a 90 angle to a stationary mirror; the other is sent to an automated moving mirror. A time delay is created between the beams resulting in destructive interference between the two paths at certain wavelengths. As a result, only photons of a single wavelength reach the sample each time for excitation. To change the wavelength of the photons, the moving mirror is adjusted causing the interference to occur at the desired wavelength. By continually adjusting the moving mirror, the instrument can scan through the entire IR. wavelength range to create a spectrum. The spectrum created is with respect to time. A Fourier transform (a mathematical operation that converts time to frequency) is performed to give spectral peak positions in wavenumbers (cm-1), a frequency unit.
6 Now that the basics of IR SPECTROSCOPY have been covered, let's examine what happens at a more detailed level. As you know, a molecule is often composed of several different atoms bound to each other covalently. Each bond type in a molecule can be excited at a characteristic frequency. Table 1 contains some common VIBRATIONAL mode frequencies for different bond types. When a bond in a molecule is vibrationally excited, a peak appears on the spectrum representing the absorption of energy at that frequency. Bond strength is directly related to frequency. In other words, more energy (a higher frequency) is required to vibrate a stronger bond. Because of this relationship, IR SPECTROSCOPY is typically used to show the presence of certain bonding types. Bond Expected Frequency Range Intensity Type of peak ( , cm-1) (Peak Size). O-H 3200-3700 strong C-O 1050-1150 strong C=O 1670-1820 strong C-H 2850-3100 medium C=C 1620-1680 variable C C 2100-2260 variable C-N 1250-1335 medium C=N 2100-2270 medium C N 2210-2260 medium S-C 570-710 weak S=C 1030-1200 strong Table 1: Stretching Frequencies of Common Bonds absorption of IR radiation leads to the VIBRATIONAL excitation of an electron.
7 This excitation leads to the stretching and compressing of bonds. VIBRATIONAL excitations that change the bond dipole are IR active. For example, Figure 4 shows the bond dipoles (purple arrows) for a molecule of carbon dioxide in 3 different stretches/compressions. The top drawing shows the dipoles of CO2. before the molecule is vibrationally excited. Once the molecule is vibrationally excited, the stretching/compressing of bonds can be symmetrical (as shown by the middle drawing) or unsymmetrical (as shown by the bottom drawing). Reading: VIBRATIONAL SPECTROSCOPY Revised: 2/24/15. O C O. O C O. O C O. Figure 4: Bond Dipoles of CO2. If the stretch is symmetric, opposite and equal magnitudes of the dipole cancel each other out completely and the overall net dipole change is zero. However, if the stretch is asymmetric, the bond dipoles do not cancel each other out, resulting in a net dipole and an IR active mode.
8 Therefore, polar molecules are always IR active and nonpolar molecules must vibrate in a nonsymmetrical way to be IR active. Raman SPECTROSCOPY is another VIBRATIONAL technique, currently gaining popularity because recent technological advances have made the instrumentation more accessible. Figure 5 shows a basic schematic of the Raman spectrometer you will use in the lab. Raman SPECTROSCOPY uses a single wavelength laser source to excite the electrons in a sample. As shown in Figure 5, the laser source is aimed at a mirror that directs the beam to a polarizer and half-wave plate. Together these components act like a collimator like an IR spectrometer, ensuring all photons are moving in the same direction for sample excitation. The laser is then sent through a beam expander to ensure the spot size is a large enough to produce a strong enough response for measurement. The objective tightly focuses the expanded beam into a fiber optic cable that guides the laser to the sample.
9 When the beam interacts with the sample, its electric field excites the molecules by inducing a change in their polarizability. (The 3. intramolecular mechanisms for this excitation are described below.) The radiation that has passed through the sample is then passed through a notch filter. The notch filter selectively blocks radiation at just the excitation beam frequency, leaving all other frequencies to pass through to the grating (monochromator) that spreads the radiation into separate frequencies for the detector. 1. 2. Reading: VIBRATIONAL SPECTROSCOPY Revised: 2/24/15. Figure 5: Instrumental Design of a Raman Spectrometer The excitation mechanisms for a change in polarizability (shown in Figure 6) are: Rayleigh scattering, Stokes scattering, and anti-Stokes scattering. a.) b.) c.) Ray Figure 6: Excitation Diagrams for Rayleigh Scattering (a), Stokes Shift (b), and Anti-stokes Shift (c).
10 Reading: VIBRATIONAL SPECTROSCOPY Revised: 2/24/15. The mechanism in Rayleigh scattering, is elastic because the excitation begins and ends in the same VIBRATIONAL state. Elastic scattering of photons is far more likely than inelastic scattering of photons. Stokes and anti-Stokes scattering, is inelastic because the initial and final energy levels of the excited electron are different VIBRATIONAL states. Stokes scattering is much more common that anti-Stokes scattering. Stokes scattering, responsible for most peaks in a Raman spectrum, occurs by the following mechanism. When a laser beam interacts with a sample, an electronic excitation occurs from the ground state (GS) to the electronic excited state (EE). A change in polarizability of the molecule causes a small loss of energy. As a result, the electron relaxes down to the VIBRATIONAL state (VE). (not the initial ground state (GS)). The frequency difference between VE and GS is equal to 2.