Transcription of Visualizing PI System Data - OSIsoft
1 Visualizing PI System data Version 2022 Feb 2022 Visualizing PI System data Page ii OSIsoft , LLC 1600 Alvarado Street San Leandro, CA 94577 All rights reserved. No part of this publication may be reproduced, stored in a retrieval System , or transmitted, in any form or by any means, mechanical, photocopying, recording, or otherwise, without the prior written permission of OSIsoft , LLC. OSIsoft , the OSIsoft logo and logotype, Managed PI, OSIsoft Advanced Services, OSIsoft Cloud Services, OSIsoft Connected Services, OSIsoft EDS, PI ACE, PI Advanced Computing Engine, PI AF SDK, PI API, PI Asset Framework, PI Audit Viewer, PI Builder, PI Cloud Connect, PI Connectors, PI data Archive, PI DataLink, PI DataLink Server, PI Developers Club, PI Integrator for Business Analytics, PI Interfaces, PI JDBC Driver, PI Manual Logger, PI Notifications, PI ODBC Driver, PI OLEDB Enterprise, PI OLEDB Provider, PI OPC DA Server, PI OPC HDA Server, PI ProcessBook, PI SDK, PI Server, PI Square, PI System , PI System Access, PI Vision, PI Visualization Suite, PI Web API, PI WebParts, PI Web Services, RLINK and RtReports are all trademarks of OSIsoft .
2 LLC. All other trademarks or trade names used herein are the property of their respective owners. GOVERNMENT RIGHTS Use, duplication or disclosure by the US Government is subject to restrictions set forth in the OSIsoft , LLC license agreement and/or as provided in DFARS , DFARS , FAR 12-212, FAR , or their successors, as applicable. No part of this publication may be reproduced, stored in a retrieval System , or transmitted, in any form or by any means, mechanical, photocopying, recording or otherwise, without the written permission of OSIsoft , LLC. Visualizing PI System data Page iii Table of Contents PI System basics .. 5 What is a PI System ? .. 5 Building Blocks of the PI System .. 8 PI Time .. 10 PI Time Expressions .. 10 Rules to Remember.
3 14 Course Simulator .. 17 PI VISION .. 20 What is PI Vision .. 20 PI Vision Home Page .. 21 Creating a new display .. 24 Features of PI Vision Displays .. 56 Advanced Features in PI Vision .. 95 Recap of PI Vision .. 95 PI Vision Calculations .. 95 Additional features in PI Vision .. 104 Managing PI Vision Displays .. 113 Analysing and Comparing Related Events .. 118 6. PI DataLink: Building Reports .. 134 PI DataLink Introduction .. 134 Finding data .. 136 Functions Returning data .. 139 Single Value Queries .. 140 Multiple Value Queries .. 149 Element Relative PI DataLink Reports .. 158 Excel Arrays in PI DataLink .. 164 Units of Measure and Descriptions as Context in Reports .. 166 More PI DataLink Functions .. 167 Using Time Filtered data in a Preventative Maintenance Example.
4 176 Filtered data Using Custom Expressions .. 183 Event-related Features of PI DataLink .. 188 Functions using an 193 Visualizing PI System data Page iv 7. Final Exercise .. 199 8. OSIsoft Supporting YOU .. 202 Learning Platform @ .. 202 OSIsoft Learning YouTube Channel @ .. 203 and the Customer Portal @ .. 206 PI Square The online PI System Community @ .. 207 Further Questions? .. 208 Appendix I: Solutions .. 209 2. PI Time .. 209 4. PI Vision .. 210 5. Advanced features in PI Vision .. 219 6. PI DataLink .. 223 Visualizing PI System data Page 5 PI System basics What is a PI System ? Learning Outcomes After completing this topic, you should be able to: Define the components of a PI System . Draw a diagram of the architecture of a PI System .
5 The PI System The PI System was originally developed by OSIsoft to collect Plant Information from PLC, DCS and SCADA systems. The PI System collects, stores, and manages time stamped data . This data may have timestamps in the past, current or future. Components of a PI System are: Computers with a PI Interface collect data (known as points or tags) from a data source. These interface nodes get data from your data sources and send it to the data Archive. This data may be collected from a variety of places, such as: o the plant, weather stations, o IT networks, o location data for trucks, o telemetry from monitoring systems. data is stored in the data Archive in such a way as to make user retrieval as efficient as possible. The data is accessible to users in different ways: directly or via tools providing context.
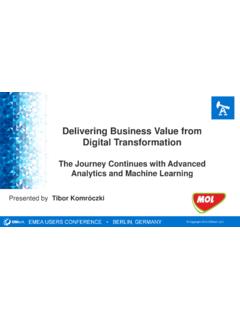
6 Accessing the data in context is provided by linking the data points to assets defined in an Asset Framework (AF) System . To visualize the data collected and stored, users use tools in the Visualization Suite: o PI Vision (browser-based graphs and symbols), o PI Datalink (a Windows based Excel add in), Visualizing PI System data Page 6 This diagram shows the 3 main categories and components of a typical PI System : Architecture of a PI System The architecture varies from simple to complex; some customers may have only a single interface sending data to a single data Archive. There are many more combinations and configurations of the PI software components, so make sure to ask your PI System administrator about how your infrastructure is laid out.
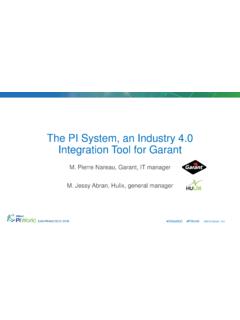
7 Here is a conceptual diagram as an example: Visualizing PI System data Page 7 Quick Check Having completed this topic, are you able to: Define the components of a PI System ? Draw a diagram of the architecture of a PI System ? If you answered NO to any of these questions, ask your instructor for assistance. Visualizing PI System data Page 8 Building Blocks of the PI System LEARNING OUTCOMES Define the terms of Asset Framework (AF) and its components: elements and attributes. Define AF attribute types: static (none), PI Point, point array, formula, string builder, table lookup and Analysis. What is an AF Element/Asset? In Asset Framework, company locations, sites, processes and each piece of equipment is represented by an Element.
8 Company Assets may be defined with an AF Element. The AF encourages organization of assets into a structure that makes it easier to find information. A self-explanatory element structure for assets goes a long way to help users find the data they are seeking. With well-defined elements showing context for the assets, data can be located without the user needing to understand the technical details of each piece of equipment. The AF element structure assists in promoting a hierarchical and logical organization of assets. What is an AF Attribute? Attributes represent a single property associated with an asset element. Attributes hold values that can represent: static information, such as the diameter of a tank a PI point stored in the data Archive, such as the current temperature of the tank contents formulas values linked to tables in relational databases values held in internal AF tables values derived from AF analytics Note: All relevant data about an asset is grouped together with AF Attributes on AF Elements.
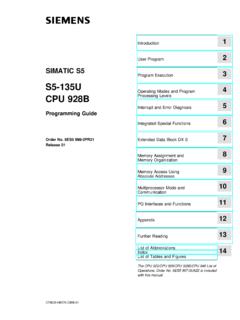
9 This allows users to build displays and reports that maintain a complete view of the company s assets. Visualizing PI System data Page 9 What is a PI Point? A PI Point (sometimes referred to as a tag) is a unique storage point for data in the data Archive. It is a single point of measurement and has a value with a timestamp, such as a temperature of oC on 2019-Dec-24 23:59. Point name Points stored in the data Archive each have a unique name. It is a common practice to name the PI Points based on Control Systems point names. Since the point is the name that identifies the point to users, a consistent point-naming convention should be used that is meaningful to people in your organization. Knowing the naming convention can be helpful in searching for points.
10 Try to determine what the following point may refer to: M03_E1P1_MOTDRV1202_RUNSTAT It refers to - Machine3 Enclosure 1 Panel 1 Motor Drive 1202 Run Status. Is this intuitive? Probably not, unless you have spent time memorizing the equipment s naming conventions. Most of the time, the PI Points themselves are not going to be easy enough for users to work with; therefore, OSIsoft recommends developing your Asset Framework hierarchy to leverage the very human friendly nature of AF Attributes on AF Assets. Building an intuitive AF structure will make end users work much easier to accomplish. Note: The PI Points are also known as PI Tag. Visualizing PI System data Page 10 PI TIME LEARNING OUTCOMES Understand PI time expressions Explain the differences between fixed and reference times Use time offsets Understand the effect of DST on the retrieval of PI point data .