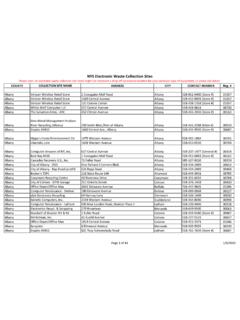
Transcription of Waste Collection - World Bank
1 WHAT A Waste : A GLOBAL REVIEW OF SOLID Waste MANAGEMENT 13. Waste Collection At a Glance: ` MSW Collection is an important aspect in maintaining public health in cities around the World . ` The amount of MSW collected varies widely by region and income level; Collection within cities can also differ greatly. ` Collection rates range from a low of 41% in low-income countries to a high of 98%. in high-income countries. Waste Collection is the Collection of solid Waste from customers. Municipalities often license private point of production (residential, industrial commercial, operators and may designate Collection areas to institutional) to the point of treatment or disposal.
2 Encourage Collection efficiencies. Municipal solid Waste is collected in several ways: Collected MSW can be separated or mixed, 1. House-to-House: Waste collectors visit each depending on local regulations. Generators can individual house to collect garbage. The user be required to separate their Waste at source, , generally pays a fee for this service. into wet (food Waste , organic matter) and dry . (recyclables), and possibly a third stream of Waste , . 2. Community Bins: Users bring their garbage or residue. Waste that is un-segregated could be to community bins that are placed at fixed separated into organic and recycling streams at points in a neighborhood or locality.
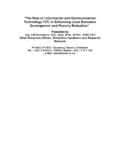
3 MSW is a sorting facility. The degree of separation can picked up by the municipality, or its designate, vary over time and by city. Separation' can be False Creek, according to a set schedule. a misnomer as Waste is not actually separated Vancouver, Canada 3. Curbside Pick-Up: Users leave their garbage directly outside their homes according to a garbage pick-up schedule set with the local authorities (secondary house-to- house collectors not typical). 4. Self Delivered: Generators deliver the Waste directly to disposal sites or transfer stations, or hire third-party operators (or the municipality). 5. Contracted or Delegated Service: Businesses hire firms (or municipality with municipal facilities) who arrange Collection schedules and charges with.
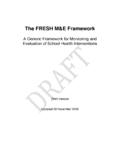
4 14 URBAN DEVELOPMENT SERIES KNOWLEDGE PAPERS. Separate Photo: Cyrus Tata garbage containers, Singapore but rather is placed out for Collection in separate Waste is more dispersed. Annex G provides data for containers without first being mixed' together. MSW Collection in cities over 100,000. Often, especially in developing countries, MSW. is not separated or sorted before it is taken for The percent of MSW collected varies by national disposal, but recyclables are removed by Waste income and by region. Higher income countries tend pickers prior to Collection , during the Collection to have higher Collection efficiency although less of process, and at disposal sites.
5 The solid Waste management budget goes towards Collection . In low-income countries, Collection The degree of source separation impacts the total services make up the bulk of a municipality's SWM. amount of material recycled and the quality of budget (as high as 80 to 90% in many cases), yet secondary materials that can be supplied. Recyclables Collection rates tend to be much lower, leading to recovered from mixed Waste , for example, tend to lower Collection frequency and efficiency. In high- be contaminated, reducing marketing possibilities. income countries, although Collection costs can However, source separation and separate Collection represent less than 10% of a municipality's budget, can add costs to the Waste Collection process.
6 Collection rates are usually higher than 90% on average and Collection methods tend to be mecha- Collection programs need to be differentiated by nized, efficient, and frequent. While total Collection type of generator. Often more attention is devoted budgets are higher, they are proportionally lower to residential Waste even though this is usually less as other budget items increase. For further infor- than 50% of the total Waste stream. Waste generated mation on estimated solid Waste management costs by the ICI sector tends to be collected better, because according to income level, please refer to Annex E. of more efficient containerization and purpose-built vehicles, and benefits from the Collection of fees.
7 The degree and sophistication of Waste picking Residential Waste Collection , on the other hand, influences overall Collection . In cities like Buenos tends to be more expensive to collect per tonne as Aires, Waste pickers tend to remove recyclables WHAT A Waste : A GLOBAL REVIEW OF SOLID Waste MANAGEMENT 15. after the Waste is placed curbside. The resulting MSW Collection by Region scattered Waste is more costly to collect: in some cases the value of recyclables are less than the Figure 5 shows MSW Collection efficiency by extra costs associated with collecting the disturbed region. Regions with low-income countries tend Waste . In some cities informal Waste pickers have to have low Collection rates.
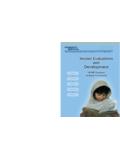
8 South Asia and Africa strong links to the Waste program and municipally are the lowest with 65% and 46% respectively. Not sanctioned crews can be prevented from accessing surprisingly, OECD countries tend to have the the Waste as informal Waste pickers process the highest Collection efficiency at 98%. Figure 4. Waste Collection by Income Waste . Waste pickers can be formally or informally organized into groups or unions with varying degrees of autonomy and political voice. FIG. 4. Waste Collection Rates by Income Containerization is an important aspect for Waste 100%. Collection , particularly from residential generators. If 90%. Waste is not set out for Collection in closed containers 80%.
9 It can be disturbed by vermin such as dogs and rats, 70%. and it can become water-logged, or set afire. 60%. 50%. Frequency of Collection is an important aspect 40%. 30%. readily under a municipality's control. From a 20%. health perspective, no more than weekly Collection 10%. is needed. However in some cities, largely because 0%. of culture and habituation, three-times per day High Income Upper Middle Lower Middle Lower Income Income Income residential Collection is offered ( Shanghai). Good Waste Collection programming requires an ongoing Figure 5. Waste Collection by Region iterative approach between Collection crews and generators (usually households).
10 Therefore, Waste FIG. 5. generators should be aware of the true costs of Waste Collection Rates by Region Collection , and ideally be charged for these directly. 100%. 90%. MSW Collection by Income 80%. 70%. The data show that the average Waste Collection 60%. rates are directly related to income levels. 50%. Low-income countries have low Collection rates, 40%. around 41%, while high-income countries have 30%. higher Collection rates averaging 98%. Figure 4 20%. 10%. shows the average Collection percentage by income. 0%. Annex K details MSW Collection rates by country. OECD MENA LAC ECA EAP SAR AFR.