Transcription of Waste Composition - World Bank
1 16 URBAN DEVELOPMENT SERIES KNOWLEDGE PAPERSW aste CompositionAt a Glance: ` Waste Composition is influenced by factors such as culture, economic development, climate, and energy sources; Composition impacts how often Waste is collected and how it is disposed. `Low-income countries have the highest proportion of organic Waste . `Paper, plastics , and other inorganic materials make up the highest proportion of MSW in high-income countries. `By region, EAP has the highest proportion of organic Waste at 62%, while OECD countries have the least at 27%, although total amount of organic Waste is still highest in OECD countries. `Although Waste Composition is usually provided by weight, as a country s affluence increases, Waste volumes tend to be more important, especially with regard to collection: organics and inerts generally decrease in relative terms, while increasing paper and plastic increases overall Waste the municipal solid Waste stream, Waste is broadly classified into organic and inorganic.
2 In this study, Waste Composition is categorized as organic, paper, plastic, glass, metals, and other. These categories can be further refined, however, these six categories are usually sufficient for general solid Waste planning purposes. Table 9 describes the different types of Waste and their sources. An important component that needs to be considered is construction and demolition Waste (C&D), such as building rubble, concrete and masonry. In some cities this can represent as much as 40% of the total Waste stream. However, in this report, C&D Waste is not included unless specifi-cally identified. A separate case-by-case review is recommended for specific , Commercial and Institutional (ICI) Waste also needs further local refinement.
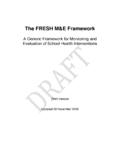
3 Many industrial processes have specific wastes and by-products. In most cities this material, with its relatively easier flow and quality control, is the first material to be recycled. Some industrial process Waste requires specific treatment. For most MSW management plans industrial by-products are not TABLE 9 Types of Waste and Their SourcesTypeSourcesOrganicFood scraps, yard (leaves, grass, brush) Waste , wood, process residuesPaperPaper scraps, cardboard, newspapers, magazines, bags, boxes, wrapping paper, telephone books, shredded paper, paper beverage cups. Strictly speaking paper is organic but unless it is contaminated by food residue, paper is not classified as , packaging, containers, bags, lids, cupsGlassBottles, broken glassware, light bulbs, colored glassMetalCans, foil, tins, non-hazardous aerosol cans, appliances (white goods), railings, bicyclesOtherTextiles, leather, rubber, multi-laminates, e- Waste , appliances, ash, other inert materialsWHAT A Waste : A GLOBAL REVIEW OF SOLID Waste MANAGEMENT17 Others47%Metal1%Glass2%Plastic4%Paper5%O rganic41%Others10%Metal1%Glass2%Plastic1 3%Paper9%Organic65%Figure 6.
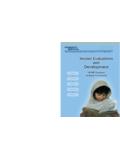
4 Waste Composition in China2000: Population Using Coal2000: Population Using GasMunicipal Waste Genereated from Population Using Coal for household heating = 49,500,000 tonsMunicipal Waste Genereated from Population Using Gas for household heating = 100,500,000 tonsTotal Municipal Waste Generation in 2000 = 150,000,000 tonsSource: Hoornweg 2005included in Waste Composition analyses, however household and general Waste should be included since it is usually disposed at common facilities, and in most cities Waste from the ICI sector repre-sents the largest fraction of the Waste Composition is influenced by many factors, such as level of economic development, cultural norms, geographical location, energy sources, and climate.
5 As a country urbanizes and populations become wealthier, consumption of inorganic materials (such as plastics , paper, and aluminum) increases, while the relative organic fraction decreases. Generally, low- and middle-income countries have a high percentage of organic matter in the urban Waste stream, ranging from 40 to 85% of the total. Paper, plastic, glass, and metal fractions increase in the Waste stream of middle- and high-income countries. For data on MSW Composition in cities with a population of over 100,000, please refer to Annex I. Figure 8 illustrates the differences between low- and high-income countries: organics make up 64% of the MSW stream for low-income countries and paper only 5%, whereas in high-income countries it is 28% and 31% respectively.
6 The IPCC uses its own classi-fication of MSW Composition based on region (See Annex N). In high-income countries, an integrated approach for organic Waste is particularly important, as organic Waste may be diverted to water-borne sewers, which is usually a more expensive influences Waste Composition by determining building materials ( wood versus steel), ash content (often from household heating), amount of street sweepings (can be as much as 10% of a city s Waste stream in dry locations), and horticultural Waste . The type of energy source FIG. 6 Waste Composition in ChinaFIG. 7 Global Solid Waste CompositionFigure 7. Global Solid Waste CompositionOther18%Metal4%Glass5%Plastic 10%Paper17%Organic46% 18 URBAN DEVELOPMENT SERIES KNOWLEDGE PAPERSin a location can have an impact on the compo-sition of MSW generated.
7 This is especially true in low-income countries or regions where energy for cooking, heating, and lighting might not come from district heating systems or the electricity grid. For example, Figure 6 shows the difference in Waste Composition in China between a section of the population that uses coal and another that uses natural gas for space heating. The other category is clearly higher: 47% when coal is used, and an ash residue is included, as opposed to 10% when natural gas is used for home heating. Climate can also influence Waste generation in a city, country, or region. For example, in Ulan Bator, Mongolia, ash makes up 60% of the MSW generated in the winter, but only 20% in the summer (UNEP/GRID-Arendal 2004).
8 Precipitation is also important in Waste Composition , particularly when measured by mass, as un-containerized Waste can absorb significant amounts of water from rain and snow. Humidity also influences Waste Composition by influencing moisture report includes Waste Composition data that was available for 105 countries from various sources. Please see Annex M for further information on MSW Composition data by country. Waste compo-sition data is generally available as percentages of the various Waste streams, commonly divided into the categories shown in Table 10. In some cases, other wastes are further disaggregated into textiles, rubber, ash, etc. However, for the purposes of standardization and simplification the other category in this report includes all of these wastes.
9 Although the definitions and methodologies for determining Composition are not always provided or standardized in the Waste studies referenced, the compositions for MSW are assumed to be based on wet weight. Each Waste category was calculated using Waste generation figures from individual countries. The total Waste Composition figures by income and by region were then aggregated. Figure 7 shows the MSW Composition for the entire World in 2009. Organic Waste comprises the majority of MSW, followed by paper, metal, other wastes, plastic, and glass. These are only approximate values, given that the data sets are from various years. Waste Composition by IncomeAs Figures 8 a-d show, the organic fraction tends to be highest in low-income countries and lowest in high-income countries.
10 Total amount of organic Waste tends to increase steadily as affluence increases at a slower rate than the non-organic fraction. Low-income countries have an organic fraction of 64% compared to 28% in high-income countries. The data presented in Figure 9 illustrates solid Waste Composition by income as compared between current values and values projected for 2025. Annex J provides data for MSW projections for 2025 by income 10 represents a compilation of Composition values of current day data presented in Annex M, and specific reports for larger countries such as China and India. Estimates for Waste Composition in 2025 are based on trends observed in OECD countries and authors Composition by Region MSW Composition by region is shown in Figures 10 a-g.