Transcription of Watershed Delineation with ArcGIS 10.2 - Trent University
1 Watershed Delineation with ArcGIS Watersheds, also known as basins or catchments, are physically delineated by the area upstream from a specified outlet point. Watersheds can be delineated manually using paper maps, or digitally in a GIS. environment. The process outlined in this document includes steps for delineating watersheds in ESRI's ArcGIS . Desktop software. This guide assumes that you have obtained the required data, which includes a digital elevation model (DEM). and stream network file for your area of interest. Note that the Ontario Ministry of Natural Resources and Forestry (OMNRF) have released many of the data outputs that are created in this process as a packaged product known as Ontario Integrated Hydrology (OIH) data.
2 Obtaining the OIH data set will allow users to skip many of the time-consuming and resource-intensive steps in the process, as noted throughout this guide. Should you have any questions regarding how to access the OIH or other government data sets, please contact us for assistance at Step 1 Set up your work environment Use the steps below to set up your map document and establish the working directory you will be using throughout the Watershed Delineation process. 1. Open ArcMap and create a new, blank map document. Use the Add Data button to add the DEM. for your area of interest to the map. 2. Browse to Geoprocessing > Environments.
3 Under Workspace, set the variables for Current Workspace and Scratch Workspace to the directory where you wish to save your results. It is a good idea to create an empty file geodatabase for this purpose. Further information about the file geodatabase format can be found here. Trent University Library Maps, Data & Government Information Centre (MaDGIC) August 2014 Software: ArcGIS 1. 3. Browse to Environment Settings > Raster Analysis and use the drop down arrow to set the Cell Size property to be the same as the DEM layer. Click OK to accept the changes. 4. If necessary, enable the Spatial Analyst extension (Customize > Extensions > Spatial Analyst).
4 5. Open ArcToolbox from the main menu and expand the Spatial Analysis Tools > Hydrology toolbox to view its contents. 6. Save your map document (File > Save). Step 2 Create a depressionless DEM. Note: This step is not necessary when using OIH data from the OMNRF. The Fill tool in the Hydrology toolbox is used to remove any imperfections (sinks) in the digital elevation model. A sink is a cell that does not have an associated drainage value. Drainage values indicate the direction that water will flow out of the cell, and are assigned during the process of creating a flow direction grid for the landscape. The resulting drainage network depends on finding the flow path' of every cell in the grid, so it is important that the fill step is performed prior to creating a flow direction grid.
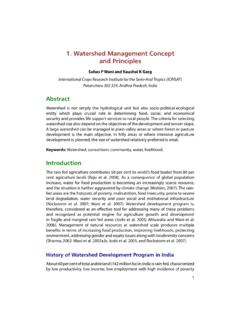
5 Double click the Fill tool to open its dialog and enter the following parameters. 1. Set the DEM grid as the Input surface raster. [screen shot]. 2. If necessary, set the Output surface raster to your working directory and provide a descriptive name for the output. 3. Accept all other defaults and click OK to run the tool. This process can be resource- intensive, and may take some time to complete depending on the processing power available to the software. Trent University Library Maps, Data & Government Information Centre (MaDGIC) August 2014 Software: ArcGIS 2. Note: The Show Help option at the bottom of the tool dialog provides help documentation for each parameter.
6 In this case, the optional input of Z limit has been left blank; but it is important that you make your own decisions regarding optional parameters, as every analysis is different and dependent on the data that is being used. When the fill process is complete, a new grid will be added to the data frame of your map document. There should be a difference in the lowest elevation value between the original DEM. and the filled DEM. You can now remove the original DEM layer from the map view (right-click > Remove) and save your map document. Step 3 Create a flow direction grid Note: This step is not necessary when using the OIH data from the OMNRF.
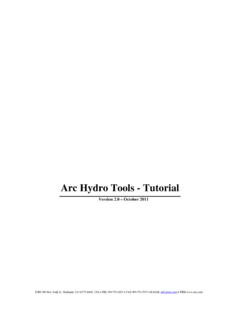
7 A flow direction grid assigns a value to each cell to indicate the direction of flow that is, the direction that water will flow from that particular cell based on the underlying topography of the landscape. This is a crucial step in hydrological modeling, as the direction of flow will determine the ultimate destination of the water flowing across the surface of the land. Flow direction grids are created using the Flow Direction tool. For every 3x3 cell neighbourhood, the grid processor finds the lowest neighbouring cell from the centre. Each number in the matrix below corresponds to a flow direction that is, if the centre cell flows due north, its value will be 64; if it flows northeast, its value will be 128, etc.
8 These numbers have no numeric meaning they are simply codes that define a specific directional value, and are determined using the elevation values from the underlying DEM. Flow direction matrix Flow direction is north, cell is coded 64. Double-click the Flow Direction tool to open the tool dialog and input the following parameters. 1. Set the Input surface raster to the filled DEM created in the Step 2. 2. If necessary, set the Output flow direction raster to your working directory and provide a descriptive name for the output file. 3. Browse to Environment Settings > Raster Analysis and confirm that the Cell Size parameter is set to the same as your filled DEM.
9 Click OK to run the tool. Trent University Library Maps, Data & Government Information Centre (MaDGIC) August 2014 Software: ArcGIS 3. This process may take quite some time to run through to completion. When the tool has finished, the new flow direction grid will be added to the map document. Step 4 Create a flow accumulation grid Note: This step is not necessary when using the OIH data from the OMNRF. The Flow Accumulation tool calculates the flow into each cell by identifying the upstream cells that flow into each downslope cell. In other words, each cell's flow accumulation value is determined by the number of upstream cells flowing into it based on landscape topography.
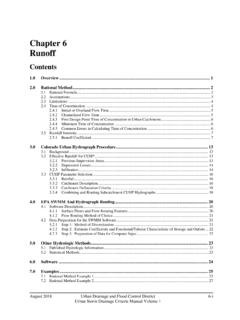
10 Double-click the Flow Accumulation tool to open the tool dialog and input the following parameters. 1. Set the Input flow direction raster to the flow direction grid created in Step 3. 2. If necessary, set the Output accumulation raster to your working directory and provide a descriptive name for the output. 3. Browse to Environment Settings > Raster Analysis and confirm that the Cell Size parameter is set to the same as your filled DEM. Click OK to run the tool. The new flow accumulation raster will be added to your map document. Each cell in the grid contains a value that represents the number of cells upstream from that particular cell.