Transcription of Hydrograph Development - USDA
1 Module 207 Hydrograph Development Module 207- Hydrograph Development Module Description Objectives Upon completion of this module, the participant will be able to: . Describe the use of hydrographs in NRCS programs . Explain the Unit Hydrograph Theory . Derive the peak rate equation . Explain how to develop composite flood hydrographs . Perform at ASK Level 3, (perform with Supervision). Prerequisites Module 107, Hydrograph Development , or its equivalent is recommended, but not required. Who May Take This Module This module is intended for all engineers, area-level technicians and others who need to understand Hydrograph Development . Content This module describes the use of hydrographs, explains the unit Hydrograph theory, derives the peak rate equation, and discusses how the unit Hydrograph is used to develop composite flood hydrographs.
2 Introduction A Hydrograph is the representation of the water surface in a stream with time. The Hydrograph can be time versus flow rate (cfs) or stage (ft). The NRCS uses hydrographs in almost all of its programs. Standard techniques are used for developing these hydrographs. Uses of Hydrographs The Natural Resources Conservation Service (NRCS) uses hydrographs in the following ways: watershed Evaluation Hydrographs are used to determine the effects of proposed structures, land treatment or land use changes on peak discharges and volume of runoff. Economic justification for projects depends upon analysis of Hydrograph data (figures 1 and 2). Floodplain delineation Standard NRCS flood hydrographs are used to outline the area flooded by rainfalls of a certain magnitude, 100 percent chance event. Design Design hydrographs are generated for sizing reservoirs, selecting type and capacity of spillway systems, and establishing critical structure elevations.
3 The one-day, ten-day Hydrograph for principal spillway design (fig. 3) is generated by a design rainfall having runoff intensity characteristics of a one-day rainfall, combined with the volume of a 10-day rainfall of the same return period frequency. The six-hour Hydrograph is frequently used for emergency spillway design (fig. 4). Farm ponds and storm water management structures are proportioned using 24-hour hydrographs. The peak flow information in TR-55 and Chapter 2, EFM was developed using 24-hour hydrographs. Dam Breach A dam breach Hydrograph is formed when impounded water is released by the sudden failure of a dam. Routing a breach Hydrograph downstream indicates hazards of existing and planned dams if they should breach. The breach Hydrograph can also be used to determine structure classification of earth dams. Unit Hydrographs The principle of the unit Hydrograph was introduced by Leroy K.
4 Sherman in 1932. Although numerous refinements have been added by others, the basic ideas presented by Sherman remain. He reasoned that, for a given watershed , all hydrographs resulting from rains of the same period of excess (unit duration) have equal time bases. Further, ordinates of each Hydrograph are proportional to the volume of runoff if the time and areal distribution of the rainfall are similar (fig. 5). A unit Hydrograph is a Hydrograph for a specific time period of rainfall excess (runoff) and uniform distribution and whose volume of runoff is equal to one inch of water over the entire watershed . Unit rainfall duration refers to the time period of rainfall producing runoff (rainfall excess). The unit Hydrograph resulting from a six-hour excess rainfall duration is referred to as a six-hour unit Hydrograph . The precipitation is assumed to occur uniformly over the entire watershed and has a uniform time distribution.
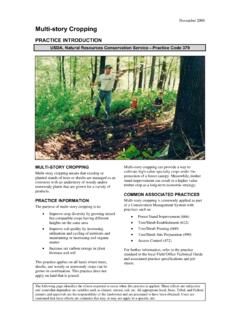
5 Unit hydrographs are used to estimate flood hydrographs by multiplying each ordinate of unit Hydrograph by the volume of runoff. Generated by a Trial Version of NetCentric Technologies CommonLook Acrobat Plug-in. Hydrograph Theory The unit Hydrograph theory is based on the principle of proportionality, such that discharge varies directly with runoff depth. Four hydrographs with the same time base, but different runoff (Q) are plotted in figure 5, using the principle of proportionality. A typical Hydrograph was drawn for Q = 1 inch. Then, hydrographs for Q = , 2, and 3 inches were drawn using the principle of proportionality. The principle would work for any value of Q ( in, in, etc.). The ratios for the other three hydrographs are calculated as follows: At time = 2 hour and for a measured runoff (Q) of 1 inch, the discharge is 218 cfs.
6 Using proportioning, the discharge for inch of runoff is calculated as follows: :.. ( in)(x) = ( in) (218 cfs) x = 109 cfs This rule is true for all coordinates on the Q = inch Hydrograph . For a runoff of in at time = 2 hr, the ratio is: : .. ( in)(x) = ( in) (218 cfs) x = 436 cfs Average Unit Hydrographs Average unit hydrographs are prepared for a gaged watershed using rain gage and stream gage records for several flood events. If flood-flow includes base flow, the base flow portion must be subtracted. Larger flood events are desirable with runoff greater than inch. An observed unit Hydrograph expresses the characteristics of both the watershed and the rain storm. To minimize effects of individual rainstorms, records of several events with about the same excess rainfall duration should be used. Adjusting each direct runoff Hydrograph to one inch of runoff and averaging these unit hydrographs will reduce the influence of storm characteristics.
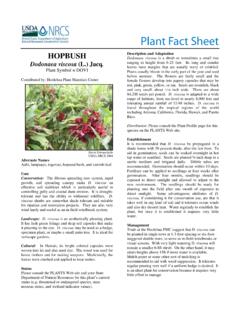
7 Dimensionless Unit Hydrographs Many design problems require hydrographs at locations for which data are not available for natural unit hydrographs. The standard NRCS dimensionless curvilinear unit Hydrograph is shown (fig. 9). Labels indicating important parameters and their interrelationship are graphically shown (fig. 10). The NRCS method stems from a procedure first expounded by Frederick F. Snyder in 1938. He relied heavily upon lag time for computing incremental rainfall duration, a concept similar to the NRCS using time of concentration for finding incremental duration. Victor Mockus worked out the NRCS unit Hydrograph methodology based upon many natural unit hydrographs from small watersheds in widely varying locations. NRCS has taken an average unit Hydrograph from many small agricultural watersheds in the Midwest and has made it dimensionless, t/ and q/q These graphs are called dimensionless unit hydrographs since values are expressed in terms of q/ and t/.
8 The mass curve has the ordinate label in volume ratios Q/Q (fig. 10). Generated by a Trial Version of NetCentric Technologies CommonLook Acrobat Plug-in. Terminology used in unit Hydrograph analyses is listed below. Units usually employed are shown in parentheses. L - Lag (hours) D - Unit Duration (hours) - Time of Concentration (hours) - Time to Peak (hours) - Time of Recession (hours) - Time of Base (hours) - Peak Discharge (cubic feet per second) Q - Total Direct Runoff (inches) - Direct Runoff at any time (inches) - Unit Peak Discharge (cfs/ watershed inches of runoff) The curvilinear shape can be approximated by a triangular shaped unit Hydrograph for convenience in manual computations and plotting (fig. 10). For most watershed conditions, the NRCS dimensionless curvilinear unit hydrographs have the following proportional volume characteristics.
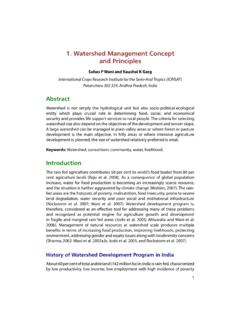
9 Rising limb percent of volume. Receding limb, percent of volume. Generated by a Trial Version of NetCentric Technologies CommonLook Acrobat Plug-in. Peak Rate Equation The peak rate equation for the NRCS unit Hydrograph depends upon shape and the percent of volume occurring before the peak compared with the percent of volume after the peak, and the curvature of the rising and receding limbs. It has been shown that a triangular approximation may be used with nearly the same final result as when using a curvilinear unit Hydrograph . Therefore, a triangular approximation will be used for deriving the peak rate equation. A = drainage Area in square miles Q = Total Direct Runoff in inches = Time to Peak in hours = Time of Recession in hours = Unit Peak Discharge in cubic feet per second/ watershed inches of runoff = Unit Peak Discharge in watershed inches of runoff/hour See derivation following: Generated by a Trial Version of NetCentric Technologies CommonLook Acrobat Plug-in.
10 Rate Equation-Incremental Unit Hydrograph Area inside triangular Hydrograph represents AQ (volume of runoff). The ratio of the two areas is .. Therefore, T = Tp AQ = sq mi-in of runoff sq mi-in of runoff per hour .. inches of runoff/hr Convert equation to cfs using proper unit conversion. 645 . Using figure 10, = + L and L = were developed from analysis of small watershed data. Flood Hydrographs Constructing flood hydrographs by summing successive unit hydrographs would be unnecessary if rainfall were of constant intensity and always of the same duration. Figure 11 shows the impact of rainfall intensity on Hydrograph shape. However, a' means for constructing hydrographs of runoff from storms of varying intensities and for any duration is available.