Transcription of What is Random Vibration Testing?
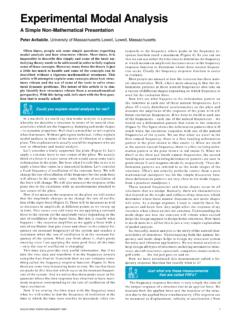
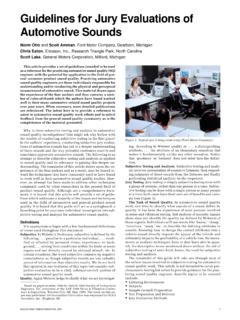
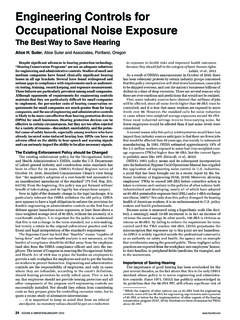
1 INSTRUMENTATION REFERENCE ISSUE 9 What is Random Vibration Testing? There is some confusion about the various tests available to the Vibration testing engineer. Difficulties encountered usually center on the differences between sinusoidal Vibration (sine testing) and Random Vibration a tuning fork and the sound you hear is the result of a single sinusoidal wave produced at a particular frequency as shown in Figure 1. The simplest musical tones are sine waves at particular frequencies. More complicated musical sounds arise from over-laying sine waves of different frequencies at the same time. Sine waves are important in more areas than music. Every structure can vibrate and has particular frequencies (resonance frequencies) in which it vibrates with the greatest amplitude. Therefore sinusoidal Vibration testing is important to help understand how any structure vibrates Vibration testing industry has made good use of sine vibra-tions to help assess the frequencies at which a particular device under test (DUT) resonates.
2 These frequencies are important to the Vibration testing engineer, because they are the frequencies at which the DUT vibrates with the greatest amplitude and, therefore, may be the most harmful to the real-world vibrations are not sinusoidal, sine testing has a limited place in the Vibration testing industry. Part of the usefulness of sine testing is its simplicity, so it s a good point of entry into the study of testing is used primarily to determine damage to structures. The best pro-sine arguments are to search for product resonances and then to dwell on one or more of them to determine modal properties and to determine fatigue life associated with each from testing a product to find and dwell at its resonance frequencies to determine fatigue life, one might also use sine testing to determine damage to equipment. A sine sweep prior to any shock or Random Vibration test will identify the dominant resonances of the tested equipment.
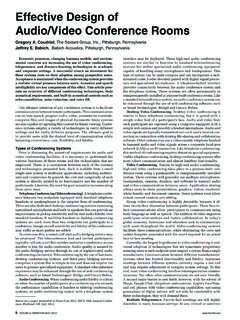
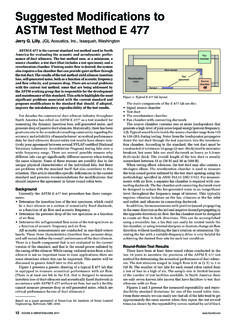
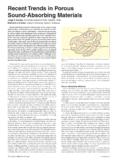
3 Repeating the sine test after otherwise abusing a product should produce the same test results unless the DUT has been damaged. Any differences in the sweeps indicate damage to the equipment perhaps something as simple as a shift in the natural resonanance frequencies that might suggest a few loose bolts need to be VibrationVibrations found in everyday life scenarios (a vehicle on a typi-cal roadway, the firing of a rocket or an airplane wing in turbulent air flow) are not repetitive or predictable like sinusoidal wave-forms. Consider the acceleration waveform shown in Figure 2 for dashboard Vibration of a vehicle traveling on Chicago Drive near Hudsonville, MI. Note that the vibrations are by no means repeti-tive. So there is an important need for tests that are not repetitive or predictable. Random Vibration testing accomplishes vs. Sine. Sinusoidal Vibration tests are not as help-ful as Random testing, because a sine test focusses upon a single frequency at any one time.
4 A Random Vibration test, on the other hand, excites all the frequencies in a defined spectrum at any given time. Consider Tustin s description of Random Vibration I ve heard people describe a continuous spectrum, say 10-2000 Hz, as 1990 sine waves 1 Hz apart. No, that is close but not quite cor-rect. Sine waves have constant amplitude and phase, cycle after cycle. Suppose that there were 1990 of them. Would the totality be Random ? No. For the totality to be Random , the amplitude and starting phase of each slice would have to vary randomly, unpre-dictably. Unpredictable variations are what we mean by Random . Broad-spectrum Random Vibration contains not sinusoids but rather a continuum of vibrations. 1 Advantages of Random Vibration Testing. One of the main goals or uses of Random Vibration testing in industry is to bring a DUT to failure. For example, a company might desire to find out how a particular product may fail because of various environmental vibrations it may encounter.
5 The company will simulate these vibrations on a shaker and opereate their product under those conditions. Testing the product to failure will teach the company many important things about its product s weaknesses and ways to improve it. Random testing is the key testing method for this kind of Vibration is also more realistic than sinusoidal Vibration testing, because Random simultaneously includes all the forcing frequencies and simultaneously excites all our product s reso-nances. 1 Under a sinusoidal test, a particular resonance frequency might be found for one part of the device under test and at a differ-ent frequency another part of the DUT may resonate. Arriving at separate resonance frequencies at different times may not cause any kind of failure, but when both resonance frequencies are excited at the same time, a failure may occur. Random testing will cause both resonances to be excited at the same time, because all frequency components in the testing range will be present at the same Power Spectral Density Function (PSD) To perform Random testing, a Random test spectrum must be defined.
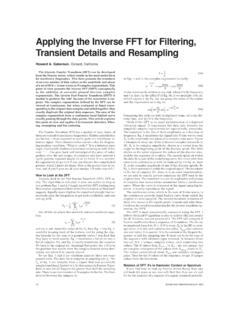
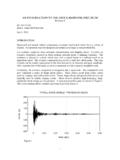
6 Real-time data acquisition utilizes spectrum-averaging to produce a statistical approximation of the Vibration spectrum. Generally the Random Vibration spectrum profile is displayed as a power spectal density (PSD) plot. This plot shows mean square ac-John Van Baren, Vibration Research Corporation, Jenison, , secDisplacement, mFigure 1. Time history of a sinusoidal waveform. Note its repeatability and predictability. , secAcceleration, gChicago Dr., Real Data: 080205 Figure 2. Acceleration time history collected on vehicle dashboard while driving in Hudsonville, SOUND & Vibration /FEBRUARY 2012celeration per unit bandwidth (acceleration squared per Hz versus frequency as shown in Figure 3). The shape of a PSD plot defines the average acceleration of the Random signal at any frequency. The area under this curve is called the signal s mean square (g2) and its square root is equal to the acceleration s overall root-mean-square (RMS) value often abbreviated Random test is conducted by using closed-loop feedback to cause the Random Vibration of a single location (typically the shaker table) to exhibit a desired PSD.
7 The PSD demonstrates how hard the shaker is working, but itdoesn t give any direct information about the forces experienced by the DUT. The g2/Hz PSD is a statistical measurement of the motion experienced at the Control point on the test object this is important to remember. Since the PSD is the result of an averaging process, an infinite number of differ-ent time waveforms could have generated such a PSD. The idea that an infinite number of real-time waveforms could generate a particular PSD can be seen from the graphs shown in Figures 4-7 produced from data collected at Vibration Research Corporation, June 28 and 30, 2005. Note that the PSD curves (Figures 6 and 7) are virtually identical although they were generated from entirely different Probability Density Function (PDF)An examination of the acceleration waveforms of Figures 4 and 5 will indicate that much of the Random Vibration acceleration values are nearly the same ( 5 g).
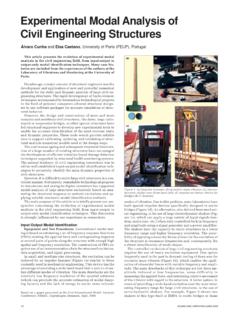
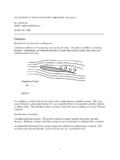
8 However, some of the accelera-tion values are quite large compared to the most common values. To help illustrate the range of acceleration values, another statistic, the probability density function (PDF) is required. A PDF is an amplitude histogram with specific amplitude scaling. Each point in the histogram is a count of the number of times the measured signal sample was found to be within a corresponding small range (an amplitude bin ) of PDF shown in Figure 8 conveys the probability of the signal being at a particular g-value at any instant in time. It s vertical units are 1/g and the area under this curve is exactly 1. Thus, the area under the PDF between any two (horizontal axis) g values is the probability of the measured signal being within that amplitude range. Note that Figure 8 is drawn using a logarithmic vertical axis. This serves to make the extreme-value tails more readable. Various weighted integrals (moments) of this function are deter-mined by the signal s properties.
9 For example, the first moment is the signal s mean ( ), the averaged or most probable value; this is necessarily equal to zero for a Random shaker Control signal. The second moment is the signal s mean square (s2) and it is equal to the area under the previously discussed PSD. The third moment is the signal s skew, an indication of bias towards larger positive or negative values; this is always equal to zero for a Random Control signal. The fourth moment is called the Kurtosis and it measures the high-g content of the signal. The horizontal axis of an acceleration PDF has units of gpeak (not RMS). This axis is often normalized by dividing the g values by the signal s RMS value s. Many signals will exhibit a symmetrical bell-shaped PDF with of the curve s area bounded by s and within 3s. Such signals are said to be normal or Gaussian. A Gaussian signal has a Kurtosis of 3 and the probability of its instantaneous amplitude being within 3s at any time is very nearly 100% (actually ).
10 There are actually many real-life situations where there are more high acceleration values than a Gaussian distribution would indicate. Unfortunately, most modern Random control techniques assume the Control signal should be Gaussian with the majority of the instantaneous acceleration values within the 3s range. This assumption removes the most damaging high peak accelerations from the test s simulation of the product s environment and under testing results. In fact, a Gaussian waveform will instantaneously exceed three times the RMS level only of the measuring field data, the situation can be considerably different, with amplitudes exceeding three times the RMS level as much as of the time. This difference can be significant, since it has also been reported that most fatigue damage is gener-ated by accelerations in the range of two to four times the RMS Significantly reducing the amount of time spent near these peak values by using a Gaussian distribution can therefore result in significantly reducing the amount of fatigue damage caused by the test relative to what the product will experience in the real world.