Transcription of WHAT IS THE DIFFERENCE BETWEEN SORTINO …
1 By Mark Bentley, Executive Vice President, BTS Asset Management, Inc. Find Opportunity It is important to align the metrics used in risk/return analysis with investors own objectives. In our experience, many conservative investors care about downside protection - that is, limiting volatility on the downside - much more than they care about volatility on the upside. WHAT IS THE DIFFERENCE BETWEEN SORTINO RATIO AND SHARPE RATIO? T he SORTINO Ratio and the Sharpe Ratio both measure risk adjusted return of an investment strategy. The Sharpe Ratio uses Standard Deviation or total volatility, both positive and negative. Upside volatility is positive return, and should not be used as a risk measure. Downside Deviation is a measure of downside risk that focuses on returns that fall below zero.
2 It is used in the SORTINO Ratio. Downside Deviation and SORTINO Ratio may provide a way to analyze performance in a manner consistent with conservative investors objectives. In our experience, investors want more risk when the markets are going up and less risk when markets are going down. One potential problem with Sharpe Ratio is that it treats risk in up markets the same way as risk in down markets, even though conservative investors may view risk differently and have different tolerance for each. The SORTINO Ratio is one metric that may help the investor to isolate the measurement for just risk in down markets specifically. To illustrate the differences , it s helpful to look at hypothetical portfolios combining Bonds (represented by the Bloomberg Barclays Aggregate Bond Index) and the BTS Tactical Fixed Income Fund.
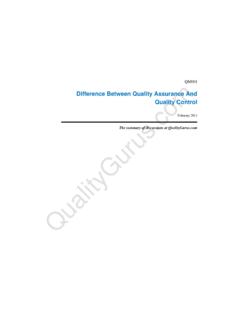
3 The BTS Tactical Fixed Income Fund s approach is designed to move 100% of assets BETWEEN three uncorrelated asset classes: High Yield when risk is on, thus seeking to capture equity exposure Treasuries when risk is off, taking advantage of the flight to quality Cash if there is not a risk-on/risk-off opportunity, in an effort to preserve capital Below is a plot of hypothetical portfolios with Downside Deviation on the horizontal axis. The combined portfolio with the highest SORTINO Ratio, as noted in the table further ahead, contains 80% BTS TFI and 20% Bonds. Then, the following page shows a similar analysis with Standard Deviation on the horizontal axis with the focus, in that case, on maximizing Sharpe Ratio. What is the DIFFERENCE BETWEEN SORTINO Ratio and Sharpe Ratio?
4 Portfolio Allocation Return % (Annualized) Downside Deviation % SORTINO Ratio 80% BTS TFI; 20% Bonds Hypothetical Return % - Downside Deviation % Bonds1 & BTS Tactical Fixed Income Fund Class A (NAV), 10 years from 1/1/08 through 12/31/17 1 Bonds is represented by the Bloomberg Barclays Aggregate Bond Index. This does not rep-resent the performance of an actual portfolio. It is not possible to invest directly in an index. Past performance does not guarantee future results and there is no assurance that the Fund will achieve its investment objective. This page and the following one help to bring out differences in risk-adjusted return analysis based on whether one focuses on SORTINO Ratio (and therefore downside volatility) or Sharpe Ratio (and therefore all volatility).
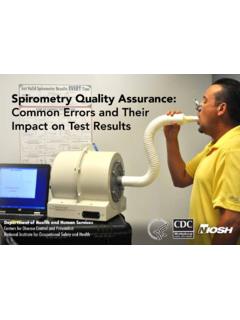
5 Whereas the chart on the prior page shows Downside Deviation on the horizontal axis, here it s Standard Deviation. As shown, a hypothetical portfolio of 20% BTS TFI/80% Bonds provided greater return and lower Standard Deviation than a 100% Bond portfolio. Among these data points, the highest Sharpe Ratio was seen with both a portfolio combination of 60% BTS TFI/40%Bonds and that of 40% BTS TFI/60% Bonds. This is noted in the table below the chart. Portfolio Allocation Return % (Annualized) Standard Deviation % Sharpe Ratio 40% BTS TFI; 60% Bonds 60% BTS TFI; 40% Bonds Hypothetical Return % - Standard Deviation % Bonds1 & BTS Tactical Fixed Income Fund Class A (NAV), 10 years from 1/1/08 through 12/31/17 1 Bonds is represented by the Bloomberg Barclays Aggregate Bond Index.
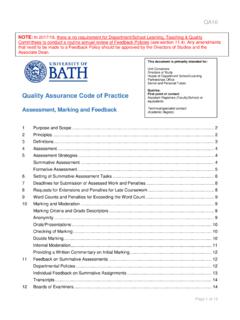
6 This does not represent the performance of an actual portfolio. It is not possible to invest directly in an index. Past performance does not guarantee future results and there is no assurance that the Fund will achieve its investment objective. The two tables presented here provide more detail on focusing on SORTINO Ratio vs. Sharpe Ratio when constructing the hypothetical portfolios. The upper table shows Downside Deviation and SORTINO Ratio for various hypothetical portfolio combinations. As seen in the corresponding chart, the highest SORTINO Ratio among the pairings shown here is for a portfolio consisting of 80% BTS TFI/20% Bonds. The lower table shows Standard Deviation and Sharpe Ratio. This table corresponds to the chart plotting hypothetical portfolios with a focus on all volatility (rather than only downside volatility).
7 In this case, the portfolio combination that maximizes the Sharpe Ratio is a tie BETWEEN 60% BTS TFI/40% Bonds and 40% BTS TFI/60% Bonds. Whether an investor is focused on downside volatility ( SORTINO Ratio) or all volatility (Sharpe Ratio), the tables reflect that risk-adjusted returns were, hypothetically, enhanced by shifting a portion of a Bond portfolio into the BTS Tactical Fixed Income Fund. What varies is the optimal percentage breakdowns for the portfolios that maximize the metric in question. In the period measured, maximizing SORTINO Ratio resulted in a substantially higher annualized return than maximizing Sharpe Ratio ( vs. ), as illustrated further in the Hypothetical Growth of $10,000 charts. This substantial differential suggests the importance of being sure to make portfolio allocation decisions based on the risk-adjusted return parameters most relevant for investors true preferences.
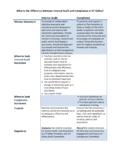
8 Hypothetical Portfolio Combination: SORTINO Ratio vs. Sharpe Ratio Bonds1 & BTS Tactical Fixed Income Find Class A (NAV), 10 years from 1/1/08 through 12/31/17 Portfolio Allocation Return % (Annualized) Downside Deviation % SORTINO Ratio 100% BTS TFI 80% BTS TFI; 20% Bonds 60% BTS TFI; 40% Bonds 40% BTS TFI; 60% Bonds 20% BTS TFI; 80% Bonds 100% Bonds Portfolio Allocation Return % (Annualized) Standard Deviation % Sharpe Ratio 100% BTS TFI 80% BTS TFI; 20% Bonds 60% BTS TFI; 40% Bonds 40% BTS TFI; 60% Bonds 20% BTS TFI; 80% Bonds 100% Bonds Hypothetical Growth of $10,000 - Annualized Return % Bonds1 & BTS Tactical Fixed Income Fund Class A (NAV), 10 years from 1/1/08 through 12/31/17 1 Bonds is represented by the Bloomberg Barclays Aggregate Bond Index.
9 This does not represent the performance of an actual portfolio. It is not possible to invest directly in an index. Past performance does not guarantee future results and there is no assurance that the Fund will achieve its investment objective. Annual Return Annual Return 60% BTS TFI; 40% Bonds 80% BTS TFI; 20% Bonds $18,824 $20,192 Fund Performance As of 9/30/18 The performance data quoted here represents past performance. Current performance may be lower or higher than the performance data quoted above. Investment return and principle value will fluctuate, so that shares, when redeemed, may be worth more or less than their original cost. Past performance is no guarantee of future results. A Fund s performance, especially for very short periods of time, should not be the sole factor in making your investment decisions.
10 For performance information current to the most recent month-end, please call toll-free 1-877-287-9820. Total Expense Ratios: Class A: ; Class C: ; Class I: ; Class R: 1 The BTS Tactical Fixed Income Fund does not have performance as a mutual fund prior to May 31, 2013. Performance prior to May 31, 2013 shown above is for the Fund's predecessor limited liability company (BTS Tactical Fixed Income Fund LLC, formerly known as BTS Asset Allocation/High Yield Fund LLC). The prior performance is net of management fees and other expenses. The predecessor limited liability company had been managed in the same style and by the same portfolio manager since the predecessor limited liability company's inception on January 1, 2000.