Transcription of Wind Chill Chart - CANDAC
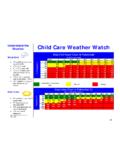
1 Environment Canada wind Chill Chart Actual Air Temperature Tair ( C). wind Speed 5 0 -5 -10 -15 -20 -25 -30 -35 -40 -45 -50. V10 m (km/h). 5 4 -2 -7 -13 -19 -24 -30 -36 -41 -47 -53 -58. 10 3 -3 -9 -15 -21 -27 -33 -39 -45 -51 -57 -63. 15 2 -4 -11 -17 -23 -29 -35 -41 -48 -54 -60 -66. 20 1 -5 -12 -18 -24 -30 -37 -43 -49 -56 -62 -68. 25 1 -6 -12 -19 -25 -32 -38 -44 -51 -57 -64 -70. 30 0 -6 -13 -20 -26 -33 -39 -46 -52 -59 -65 -72. 35 0 -7 -14 -20 -27 -33 -40 -47 -53 -60 -66 -73. 40 -1 -7 -14 -21 -27 -34 -41 -48 -54 -61 -68 -74. 45 -1 -8 -15 -21 -28 -35 -42 -48 -55 -62 -69 -75. 50 -1 -8 -15 -22 -29 -35 -42 -49 -56 -63 -69 -76. 55 -2 -8 -15 -22 -29 -36 -43 -50 -57 -63 -70 -77. 60 -2 -9 -16 -23 -30 -36 -43 -50 -57 -64 -71 -78. 65 -2 -9 -16 -23 -30 -37 -44 -51 -58 -65 -72 -79. 70 -2 -9 -16 -23 -30 -37 -44 -51 -58 -65 -72 -80. 75 -3 -10 -17 -24 -31 -38 -45 -52 -59 -66 -73 -80. 80 -3 -10 -17 -24 -31 -38 -45 -52 -60 -67 -74 -81.
2 Where Tair = Actual Air Temperature in C. V10 m = wind Speed at 10 metres in km/h (as reported in weather observations). Notes: 1. For a given combination of temperature and wind speed, the wind Chill index corresponds roughly to the temperature that one would feel in a very light wind . For example, a temperature of -25 C and a wind speed of 20 km/h give a wind Chill index of -37. This means that, with a wind of 20 km/h and a temperature of -25 C, one would feel as if it were -37 C in a very light wind . 2. wind Chill does not affect objects and does not lower the actual temperature. It only describe how a human being would feel in the wind at the ambient temperature. 3. The wind Chill index does not take into account the effect of sunshine. Bright sunshine may reduce the effect of wind Chill (make it feel warmer) by 6 to 10 units. Frostbite Guide Low risk of frostbite for most people Increasing risk of frostbite for most people within 30 minutes of exposure High risk for most people in 5 to 10 minutes of exposure High risk for most people in 2 to 5 minutes of exposure High risk for most people in 2 minutes of exposure or less