Transcription of Worksheet: Interpreting Graphs - Triton Science
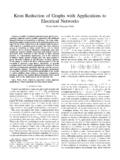
1 Name _____ Date _____ Period _____ worksheet : Interpreting Graphs C H A P T E R 4 : L I N E A R M O T I O N Interpreting Graphs - As I have said many times in class, a picture is worth a thou-sand words . In physics, a graph is worth a thousand numbers . A great deal of information can be obtained by looking and interpret-ing Graphs describing motion (displacement, speed, velocity, and acceleration). Distance vs. Time Graphs - To the right is a typical graph displaying Distance vs. Time. One or more objects may be graphed at one time, so you can compare the relative positions, speeds and displacement as they relate to each other. Directions: Answer the following questions as they apply to the Motions Graphs and diagrams. graph 1: Questions 1-7 1. What does the slope of each line on the graph tell you?
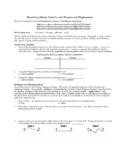
2 2. Which runner completed the 100m race in the least amount of time? What was his time? 3. Which runner started out the fastest? 4. What was Charlie doing between 8 seconds and seconds? 5. What does a straight line on this graph tell you? A curved line? 6. At what distance and time did Albert overtake Bob? 7. What was the total displacement of all three runners ( d)? graph 1 graph 2: Questions 8-13 8. What is happening between 9AM and 11AM? 9. What do you think bicyclist is doing between 11AM and 1PM? 10. What was the total distance covered by 11AM, 1PM, and 4PM? 11. What was the average velocity of the bicyclist between 9Am and 11AM? 12 What was the average velocity over the entire trip? 13. Is the speed a positive or negative number? Could speed ever be a negative number?
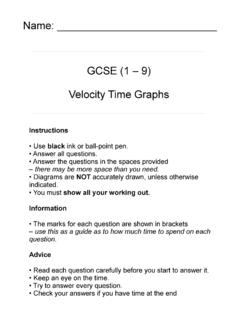
3 graph 3: Questions 14- 14. What does line a represent? 15. What is the difference in velocities between points a, b, and c? 16. What do we call it when velocity changes over time? 17. What is the average velocity between time 0 and 3 seconds? Show your work. graph 2 graph 3