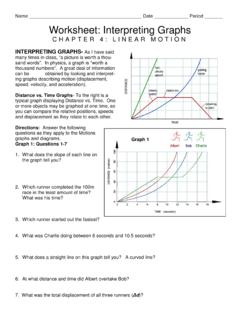
Transcription of Motion Graphs - State University of New York at Oswego
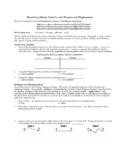
1 Motion Graphs It is said that a picture is worth a thousand words. The same can be said for a graph . Once you learn to read the Graphs of the Motion of objects, you can tell at a glance if the object in question was moving toward you, away from you, speeding up slowing down, or moving at constant speed. Case Study #1. Imagine you are standing by the side of the road. An automobile approaches you from behind, traveling at a constant speed. Then the car passes you, disappearing off into the distance. To graph the Motion of this car, you will need some data. The Data Table Using a stopwatch and roadside markers, you keep track of how far the car is from you (it's displacement) at each moment in time. Negative time (s) displacement (m). displacements show 0 -30. that the car was 1 -20. behind you. 2 -10. 3 0. Positive 4 10. displacements show 5 20. that the car was in 6 30. front of you. graph for Case Study #1. Car is in front of you. Car is behind you.
2 Slope of graph The slope of a displacement vs. time graph tells us the object's velocity. In this case, the line is straight, meaning that the slope (and hence, the velocity). remains constant for this automobile. Calculating the Slope In mathematics, the slope of a graph is expressed as the rise over the run. rise run Slope as Velocity In this particular example, we have put time ( t) on the horizontal axis and displacement ( x) on the vertical axis. The equation now becomes: Finding the Velocity of Our Car Laying out a triangle on our graph helps us find the values for the rise and the run. ( , 20). Rise = x ( , -20). Run = t Case Study #2. Here's a graph that describes the Motion of another car you see while standing along the side of the road. Can you describe in words the Motion of this car? Case Study #2. If you said that this car approached you from in front, and then passed on by you, you were correct! It is also true that this car is traveling at a constant velocity (the graph line is straight.)
3 But is it the same constant velocity the last car had? Velocity from Slope It is the same velocity if the slope of the graph line is the same. To find out, we (0, 30). must calculate the In the case of this graph , the rise is actually a slope. drop . The value of the displacement drops from an original value of 30 m down to 15 meters. ( , -15). Results for Case Study #2. And so we see that this second car is traveling a bit slower than the first one; its velocity coming in with a magnitude of m/s instead of 10 m/s. The negative sign on the second car's velocity means that it was traveling in the opposite direction of the first car. That's easy to tell at a Positive slope glance, just by looking (car #1). at the two Graphs . Negative slope (car #2). Graphing Both Cars It is much easier to compare the motions of the two cars when you graph those motions on the same set of axes. Car 1. Car 2. Intersections and Intercepts Of particular interest is the center section of the graph .
4 Can you figure out what's happening at each of the labelled points A, B, and C? Intersections and Intercepts Point A is where the first car (that came from behind). passes you. Point B is where the two cars pass each other (in front of you). Point C is where the second car (that came from in front of you) passes you by. Where graph lines intersect the Where graph lines intersect horizontal axis is where the each other is where the objects pass by the observer. objects pass each other. Moving in the Same Direction When two cars are moving in the same direction, it is much easier to compare their speeds, both in real life, and on a graph . The slopes of their graph lines are obviously different. The slope for car 1 is steeper, therefore it must be going faster. For practice, try calculating the slope of each car's graph line. Check Your Work! Here are the velocities, calculated for each of the two cars, from the slopes of their graph lines. For Car 1 For Car 2.
5 Case Study #4. A black car is traveling along the highway at constant velocity. A blue car follows along behind it, at the same velocity. The black car pulls to the side of the road Displacement Displacement time (s) black car (m) blue car (m). and stops. The blue car pulls up behind it 0 0 -10. and also stops. 1 10 0. 2 20 10. First, we look at the 3 30 20. data table that 30 25. describes their 4 30 25. Motion , then we'll 5 30 25. graph it. Case Study #4. Reading Information off the graph The graph lines are parallel, so both cars have the same constant velocity. You can tell when the cars are motionless because the slope of their graph lines is zero, meaning zero velocity. While moving, the distance When parked, the separating the cars remains distance separating the constant at 10 meters. cars is now only 5 meters. What's Different About This One? Reading the graph As before, the blue car followed the black car while traveling along the highway at constant velocity.
6 Just as before, the black car pulled over and stopped. What's different is that this time, the blue car passed the black car and then pulled over to stop in front of it. In the end, the blue car's displacement We know this is greater. because, in the end, The blue car the blue car is passes the farther out in front. black car here. The New Motorcycle Your friend just bought a new motorcycle and wants to show it off for you. Look at the graph below, and see if you can describe the Motion of your friend on his new machine. Describing the Motion For segment A-B, For segment C-D, your friend is your friend is going away from returning to you. you at constant velocity. For segment B-C, your friend has stopped moving. Quantifying the Results Because we have grid lines and numbers on the axes, we can include numerical values in our descriptions. During segment A-B, we can see that your friend travels 30 meters out in front of you. x The slope calculation tells us how fast he was going.
7 T Quantifying the Results For segment B-C, your friend remains at a distance of 30 meters in front of you for 3 seconds. He's motionless. The slope of the graph line is quite obviously zero, but if you had to show your work, here's how you'd do it. Quantifying the Results t For the C-D segment, the distance between you and your friend continuously decreases as he returns to you. Again, a slope calculation tells us how fast he's going. x Curved Lines Mean Changing Slopes The slope gets steeper with time. This means the object's velocity is increasing. (As before, the increasing displacement means it's going away from you.). The slope flattens out with time. This means the object's velocity is decreasing, approaching zero. (As before, the increasing displacement means it's going away from you.). Curved Lines Mean Changing Slopes The slope flattens out with time. This means the object's velocity is decreasing, approaching zero. (The decreasing displacement means the object is approaching you.)
8 The slope gets steeper with time. This means the object's velocity is increasing. (The decreasing displacement means the object is getting closer to you.). Case Study #5. An object slides down a ramp, picking up speed as it goes. We can figure out how fast the object was going by calculating the slope, but, depending upon which instant in time we pick, we will get a different answer. Finding the Velocity (Slope) at a Particular Point Step 1: Draw a straight line tangent to the curved graph line at the point in time you've selected. (Here , it's at t = seconds). Finding the Velocity (Slope) at a Particular Point Step 2: Construct a right triangle, using the tangent line as its hypotenuse. (The other two sides of the triangle will become the rise and the run.). rise run Finding the Velocity (Slope) at a Particular Point Step 3: By carefully reading the graph , obtain the coordinates of the end points of the tangent line. You will Warning! use these to calculate Do not use the coordinates of x and t.
9 The nearby ( , 15) points on the curved graph x line. ( , 3) t Finding the Velocity (Slope) at a Particular Point Step 4: Calculate the slope as before. ( , 15). x ( , 3) t Finding the Velocity (Slope) at a Particular Point For comparison, we will now find the slope at another point on the graph . Let's use t = s. Step 1: Draw the tangent line to the graph at t = s. Finding the Velocity (Slope) at a Particular Point Step 2: Draw the right ( , 35). triangle and obtain the coordinates of the tangent line's end points. x ( , 15). t Finding the Velocity (Slope) at a Particular Point Step 3: Calculate the ( , 35). slope, as before. x ( , 15). t Case Study #6. Imagine you're standing at the top of a ramp. Your friend rolls a ball up the ramp toward you. The following graph describes the Motion of the ball. For additional practice, try finding the velocity of the ball at several different instants in time through slope calculation. By the way: the ramp is straight, not curved.
10 This is a graph of the ball's Motion , not a picture of the ramp! Velocity vs. Time Graphs We will now remove displacement from the vertical axis of our Graphs and replace it with velocity. Although slope is still rise over run, the rise part of the equation will now read change in velocity , v, instead of x. rise run Slope as Acceleration Our slope equation now becomes: Since slopes can be either positive or negative, accelerations can be either positive or negative. Speeding Up or Slowing Down? Warning: Many people mistakenly believe that a positive acceleration means the object is speeding up and a negative acceleration means the object is slowing down. Here's the truth: If the numerical values of an object's velocity and acceleration have the same sign (both positive or both negative), then the object is speeding up. If the velocity and acceleration have opposite signs (one of positive and the other is negative), then the object is slowing down.