Transcription of World Map of the Köppen-Geiger climate classification …
1 Meteorologische Zeitschrift, , No. 3, 259-263 (June 2006)c by Gebr der Borntraeger 2006 ArticleWorld Map of the K ppen-Geiger climate classificationupdatedMARKUSKOTTEK1, J RGENGRIESER2, CHRISTOPHBECK2, BRUNORUDOLF2and FRANZRUBEL 11 Biometeorology Group, University of Veterinary Medicine Vienna, Vienna, Austria2 Global Precipitation Climatology Centre, Deutscher Wetterdienst, Offenbach, Germany(Manuscript received December 19, 2005; in revised form February 28, 2006; accepted April 10, 2006)AbstractThe most frequently used climate classification map is that of Wladimir K ppen, presented in its latest version1961 by Rudolf Geiger.
2 A huge number of climate studies and subsequent publications adopted this or aformer release of the K ppen-Geiger map. While the climate classification concept has been widely appliedto a broad range of topics in climate and climate change research as well as in physical geography, hydrology,agriculture, biology and educational aspects, a well-documented update of the World climate classificationmap is still missing. Based on recent data sets from the Climatic Research Unit (CRU) of the University ofEast Anglia and the Global Precipitation Climatology Centre (GPCC) at the German Weather Service, wepresent here a new digital K ppen-Geiger World map on climate classification , valid for the second half ofthe am h ufigsten verwendete Klimaklassifikationskarte istjene von Wladimir K ppen, die in der letztenAuflage von Rudolf Geiger aus dem Jahr 1961 vorliegt.
3 Seitherbildeten viele Klimab cher und Fachartikeldiese oder eine fr here Ausgabe der K ppen-Geiger Karte das Schema der Klimaklassifikationin vielen Forschungsgebieten wie Klima und Klima nderung aber auch physikalische Geographie, Hydrolo-gie, Landwirtschaftsforschung, Biologie und Ausbildung zum Einsatz kommt, fehlt bis heute eine gut doku-mentierte Aktualisierung der K ppen-Geiger Klimakarte. Basierend auf neuesten Datens tzen des ClimaticResearch Unit (CRU) der Universit t von East Anglia und des Weltzentrums f r Niederschlagsklimatologie(WZN) am Deutschen Wetterdienst pr sentieren wir hier eineneue digitale K ppen-Geiger Weltkarte f r diezweite H lfte des 20.
4 First quantitative classification of World climateswas presented by the German scientist Wladimir K p-pen (1846 1940) in 1900; it has been available asworld map updated 1954 and 1961 by Rudolf Geiger(1894 1981). Many of the early German publications(K PPEN, 1900; GEIGER1954, 1957) from this area arenot easily accessible today; here we refer to the compre-hensive summaries on this topic given by, , HANTEL(1989) or ESSENWANGER(2001).K ppen was trained as a plant physiologist and re-alised that plants are indicators for many climatic el-ements.
5 His effective classification was constructed onthe basis of five vegetation groups determined by theFrench botanist De Candolle referring to the climatezones of the ancient Greeks (SANDERSON, 1999) Thefive vegetation groups of K ppen distinguish betweenplants of the equatorial zone (A), the arid zone (B), thewarm temperate zone (C), the snow zone (D) and the po-lar zone (E). A second letter in the classification consid- Corresponding author: Franz Rubel, Biometeorology Group, De-partment of Natural Sciences, University of Veterinary Medicine Vi-enna, 1210 Vienna, Austria, e-mail: the precipitation ( Df for snow and fully humid),a third letter the air temperature ( Dfc for snow, fullyhumid with cool summer).
6 Although various authors published enhanced K p-pen classifications or developed new classifications, theclimate classification originally developed by K ppen(here referred to as K ppen-Geiger classification ) is stillthe most frequently used climate classification . Manytextbooks on climatology reproduce a World map ofK ppen-Geiger climate classes, due to the lack of recentmaps mostly a copy of one of the historical hand-drawnmaps ( , KRAUS, 2004). In order to close this gapwe present a digital World map of the K ppen-Geigerclimate classification calculated from up-to-date globaltemperature and precipitation data importance of an updated digital map may berecognized by looking at global and regional studies thatuse the K ppen-Geiger climate classification .
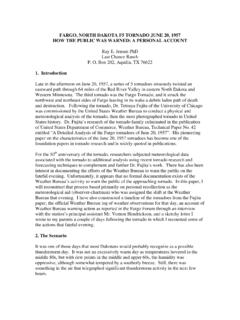
7 Represen-tative for hydrological studies PEELet al. (2001) iden-tified and explained the continental-scale variability inannual runoff by applying K ppen s climate classifica-tion. Applications to climate modelling have been pre-sented, for example, by LOHMANNet al. (1993) to val-idate general circulation model control runs of presentDOI: $ Gebr der Borntraeger, Berlin, Stuttgart 2006260M. Kottek et al.: World Map of the K ppen-Geiger climate classification updatedMeteorol. Z.,15, 2006 Table 1:Key to calculate the climate formula of K ppen and Geiger for the main climatesand subsequent precipitation conditions, the firsttwo letters of the classification .
8 Note that for the polar climates (E) no precipitation differentiations are given, only temperature conditionsare defined. This key implies that the polar climates (E) have to be determined first, followed by the arid climates (B) and subsequentdifferentiations into the equatorial climates (A) and the warm temperate and snow climates (C) and (D), respectively. The criteria areexplained in the climatesTmin +18 CAfEquatorial rainforest, fully humidPmin 60 mmAmEquatorial monsoonPann 25(100 Pmin)AsEquatorial savannah with dry summerPmin<60 mm in summerAwEquatorial savannah with dry winterPmin<60 mm in winterBArid climatesPann<10 PthBSSteppe climatePann>5 PthBWDesert climatePann 5 PthCWarm temperate climates 3 C<Tmin<+18 CCsWarm temperate climate with dry summerPsmin<Pwmin, Pwmax>3 Psminand Psmin<40 mmCwWarm temperate climate with dry winterPwmin<Psminand Psmax>10 PwminCfWarm temperate climate , fully humidneither Cs nor CwDSnow climatesTmin 3 CDsSnow climate with dry summerPsmin<Pwmin.
9 Pwmax>3 Psminand Psmin<40 mmDwSnow climate with dry winterPwmin<Psminand Psmax>10 PwminDfSnow climate , fully humidneither Ds nor DwEPolar climatesTmax<+10 CETT undra climate0 C Tmax<+10 CEFF rost climateTmax<0 Cclimate as well as greenhouse gas warming al. (2000) investigated the maximum possi-ble influence of vegetation on the global climate by con-ducting climate model simulations. Both, LOHMANN etal. (1993) and KLEIDONet al. (2000) applied the K p-pen classification to model simulations to illustrate thedifferences in simulation results.
10 The updated K ppen-Geiger climates presented here will support future stud-ies similar to those discussed and methodTwo global data sets of climate observations have beenselected to update the historical World map of theK ppen-Geiger climate classes. Both are available on aregular degree latitude/longitude grid with monthlyresolution. The first data set is provided by the Cli-matic Research Unit (CRU) of the University of EastAnglia (MITCHELLand JONES, 2005) and delivers gridsof monthly climate observations from meteorologicalstations comprising nine climate variables from whichonly temperature is used in this study.