Transcription of Writing up your results – APA Style guidelines
1 PY602 R. Guadagno Spring 2010 1 Writing up your results guidelines based on APA Style In a results section, your goal is to report the results of the data analyses used to test your hypotheses. To do this, you need to identify your data analysis technique, report your test statistic, and provide some interpretation of the results . Each analysis you run should be related to your hypotheses. And if you analyze data that is exploratory, you need to indicate this. If your results are complicated you have many conditions and/or many dependent measures, adding a table of figure can be helpful.
2 See the APA Publication manual (5th edition) for examples. In reporting the results of statistical tests, report the descriptive statistics, such as means and standard deviations, as well as the test statistic, degrees of freedom, obtained value of the test, and the probability of the result occurring by chance (p value). Test statistics and p values should be rounded to two decimal places (if you are providing precise p-values for future use in meta-analyses, 3 decimal places is acceptable). All statistical symbols (sample statistics) that are not Greek letters should be italicized (M, SD, t, p, etc.)
3 When reporting a significant difference between two conditions, indicate the direction of this difference, which condition was more/less/higher/lower than the other condition(s). Assume that your audience has a professional knowledge of statistics. Do not explain how or why you used a certain test unless it is unusual ( , such as a non-parametric test). In the sections below, there are examples and tips for how to report your test statistics. We will cover many of the tests you are learning in this class and will likely use regularly in the future. We will also touch upon data analysis techniques that you will learn in other classes ( , regression).
4 P values There are two ways to report p values. One way is to use the alpha level (the a priori criterion for the probability of falsely rejecting your null hypothesis), which is typically .05 or .01. Example: F(1, 24) = , p < .01. You may also report the exact p value (this is the preferred option if you want to make your data convenient for individuals conducting a meta-analysis on the topic). For example: t(33) = , p = .03. If your exact p value is less than .001, it is conventional to state merely p < .001. If you report exact p values, state early in the results section the alpha level used as a significance criterion for your tests.
5 For example: We used an alpha level of .05 for all statistical tests. What if your results are in the predicted direction but not significant? If your p-value is .10 or less, you can say your results were marginally significant. Example: results indicated a marginally significant preference for pecan pie (M = , SD = ) over cherry pie (M = , SD = .80), t(5) = , p = .08. If your p-value is over .10, you can say your results revealed a non-significant trend in the predicted direction. Example: results indicated a non-significant trending in the predicted direction indicating a preference for pecan pie (M = , SD = ) PY602 R.
6 Guadagno Spring 2010 2 over cherry pie (M = , SD = ), t(5) = , p = .26. Note: this is one example where disciplines vary but this is what is acceptable in Social Psychology. Descriptive Statistics Mean and Standard Deviation are most clearly presented in parentheses: The sample as a whole was relatively young (M = , SD = ). The average age of students was years (SD = ). Percentages are also most clearly displayed in parentheses with no decimal places: Nearly half (49%) of the sample was married. t-tests There are several different research designs that utilize a t-test for the statistical inference testing.
7 The differences between one-sample t-tests, related measures t-tests, and independent samples t-tests are so clear to the knowledgeable reader that most journal editors eliminate the elaboration of which type of t-test has been used. Additionally, the descriptive statistics provided will identify further which variation was employed. It is important to note that we assume that all p-values represent two-tailed tests unless otherwise noted and that independent samples t-tests use the pooled variance approach (based on an equal variances assumption) unless otherwise noted: There was a significant effect for gender, t(54) = , p <.
8 001, with men receiving higher scores than women. results indicate a significant preference for pecan pie (M = , SD = ) over cherry pie (M = , SD = .80), t(15) = , p = .001. The 36 study participants had a mean age of (SD = ) were significantly older than the university norm of years, t(35) = , p = Students taking statistics courses in psychology at the University of Washington reported studying more hours for tests (M = 121, SD = ) than did UW college students in general, t(33) = , p = .034. The 25 participants had an average difference from pre-test to post-test anxiety scores of (SD = ), indicating the anxiety treatment resulted in a significant decrease in anxiety levels, t(24) = , p =.
9 005 (one-tailed). The 36 participants in the treatment group (M = , SD = ) and the 25 participants in the control group (M = , SD = ), demonstrated a significance difference in performance (t[59] = , p = .01); as expected, the visual priming treatment inhibited performance on the phoneme recognition task. UW students taking statistics courses in Psychology had higher IQ scores (M = 121, SD = ) than did those taking statistics courses in Statistics (M = 117, SD = ), t(44) = , p = .09. Over a two-day period, participants drank significantly fewer drinks in the experimental group (M= , SD = ) than did those in the wait-list control group (M= , SD= ), t(4) = , p=.
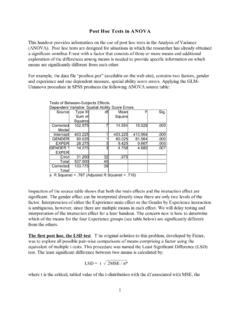
10 005. ANOVA and post hoc tests ANOVAs are reported like the t test, but there are two degrees-of-freedom numbers to report. First report the between-groups degrees of freedom, then report the within-groups degrees of PY602 R. Guadagno Spring 2010 3 freedom (separated by a comma). After that report the F statistic (rounded off to two decimal places) and the significance level. One-way ANOVA: The 12 participants in the high dosage group had an average reaction time of seconds (SD = ); the 9 participants in the moderate dosage group had an average reaction time of seconds (SD = ), and the 8 participants in the control group had a mean of (SD = ).