Transcription of MULTIPLE COMPARISONS - SurgicalCriticalCare.net
1 MULTIPLE COMPARISONS / 41. CHAPTER SEVEN. MULTIPLE COMPARISONS . As we saw in the last chapter, a common statistical method for comparing the means from two groups of patients is the t-test. Frequently, however, we wish to compare more than two groups of patients in order to determine whether a difference exists between any or all of the groups involved. There are several statistical methods for simultaneously comparing several groups of patients, all of which are examples of MULTIPLE comparison procedures. MULTIPLE T-TESTS. One option for comparing three or more groups of patients is to perform two-sample, unpaired t-tests on each of the possible pairwise combinations of the data, and compare the resulting p-values.
2 As we will see, however, this method is not appropriate as the t-test is designed to evaluate differences between only two groups of patients. The use of MULTIPLE t-tests in this manner is one of the most commonly seen statistical errors in the medical literature. For example, consider a study in which we randomly assign 100 patients to receive one of four different antibiotics (Drug A, B, C, and D) prior to operation, and we wish to assess the efficacy of each drug in preventing post-operative wound infections. In order to analyze the four groups of data using t-tests, we would need to perform two-sample, unpaired t-tests on each of the following 6 pairwise COMPARISONS : Drug A vs Drug B Drug A vs Drug C Drug A vs Drug D.
3 Drug B vs Drug C Drug B vs Drug D Drug C vs Drug D. The problem with this approach is that with each comparison we make, there is always a chance, however small, that we will commit a Type I error; that is, we will erroneously reject the null hypothesis when, in reality, there is no difference between the groups. In a single two-sample t-test with a significance level of , the likelihood of making such a Type I error is only 5%. This is known as the per- comparison error rate. However, if we use the same two-sample t-test to evaluate all four groups of data and perform all 6. possible pairwise COMPARISONS , the likelihood of making a Type I error in at least one of our 6 COMPARISONS rises to 30% ( x 6).
4 This is known as the per-experiment error rate. Instead of having 95% confidence that our conclusions are correct, our confidence is now decreased to 70% and we are more likely to commit a Type I error. Thus, the two-sample t-test can lead to erroneous conclusions if we improperly use it to make MULTIPLE COMPARISONS . We could still use t-tests to perform MULTIPLE COMPARISONS , acknowledging the increased per-experiment error rate, if it weren't for another problem. The use of MULTIPLE t-tests results in the calculation of MULTIPLE p- values (one for each comparison ) which can only be used to compare the two groups within each comparison .
5 There is not a separate p-value which we can use to compare all of the groups simultaneously and thereby document that one therapy or treatment is better than the rest. Thus, using t-tests we still cannot compare more than two groups of patients at a time. MULTIPLE t-tests should therefore not be used in the statistical analysis of more than two groups of data. BONFERRONI ADJUSTMENT. As noted above, if we use two-sample statistical tests to perform MULTIPLE COMPARISONS , the potential for error (the per-experiment error rate) is additive such that we are more likely to make erroneous conclusions. The Bonferroni adjustment takes this increase in the per-experiment error rate into account by adjusting the per- comparison error rate downward so that the likelihood of making a Type I error with each comparison is decreased.
6 The Bonferroni adjustment allows us to ask the question Are all of the groups different from each other? . For example, in our study on antibiotic efficacy we were interested in comparing four groups of patients. If we wished to determine that all four groups were different from one another with 95% confidence, our overall 42 / A PRACTICAL GUIDE TO BIOSTATISTICS. per-experiment error rate would need to be To determine the per- comparison error rate for each test using the Bonferroni adjustment, we would divide our desired per-experiment error rate by the number of COMPARISONS . For this example, the per- comparison error rate for each t-test would then be or We would thus perform the six t-tests using a significance level of If all six t-tests resulted in a p-value of less than , we could then state that all four groups were statistically different from one another with 95% confidence (a significance level of ).
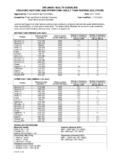
7 One problem with the Bonferroni method is that it only estimates the true per-experiment error rate. The actual chance of making a Type I error may be much less. Consider the case where one of our four antibiotics (Drug B) is much more effective in preventing wound infections than are the other three (whose efficacies are all very similar). If we perform two-sample t-tests on each of the six possible combinations, we might obtain the following results (note that our analysis results in six different p-values which cannot be used to evaluate the study as a whole): Wound Infection Rates for Drugs A, B, C, and D. comparison p-value comparison p-value Drug A vs Drug B Drug B vs Drug C Drug A vs Drug C Drug B vs Drug D Drug A vs Drug D Drug C vs Drug D Using the Bonferroni adjustment, in order to have 95% confidence in our results, our per- comparison significance level must be ( ) and our hypotheses would be as follows: Null Hypothesis: none of the drugs prevent wound infections Alternate Hypothesis.
8 All four drugs prevent wound infections Based on the Bonferroni adjustment, in order to reject our null hypothesis with 95% confidence, each of the six p-values must be less than Since this is not the case, we must accept our null hypothesis and conclude that none of the drugs are efficacious in preventing wound infections. This is clearly not the case, however, as the efficacy of Drug B is significantly greater than that of Drugs A, C, and D. In this situation, use of the Bonferroni adjustment results in our ignoring the significant differences present. The Bonferroni adjustment, by being a very conservative statistical test, loses statistical power and is more likely to result in a Type II error.
9 By lowering the per- comparison error rate, it reduces the likelihood of erroneously concluding that a difference exists for the experiment as a whole (a Type I error), but at the same time makes it more likely that a significant difference among the groups will be missed (a Type II error). ANALYSIS OF variance (ANOVA). A common solution to the issue of comparing three or more groups is a test known as analysis of variance or ANOVA. It addresses the question of whether there are differences between the means of the groups. It does not, however, identify which of the groups differ from one another. It is a method which expands on the traditional t-test allowing evaluation of MULTIPLE groups of observations without the increased risk of a Type I error.
10 Like the t-test, ANOVA makes three assumptions. First, the observations are assumed to be normally distributed. If this is not the case, the data must first be transformed to a normal distribution or a non- parametric MULTIPLE COMPARISONS method must be utilized. Second, the population variance is assumed to be the same in each group. The importance of this assumption is lessened if the sample sizes are equal. Third, the observations in each group must be independent and cannot affect the values of observations in another group. As with any statistical analysis, the raw data should be examined initially to determine whether these assumptions are met.