Transcription of CORRELATION AND REGRESSION - …
1 CORRELATION AND REGRESSION / 47. CHAPTER EIGHT. CORRELATION AND REGRESSION . CORRELATION and REGRESSION are statistical methods that are commonly used in the medical literature to compare two or more variables. Although frequently confused, they are quite different. CORRELATION measures the association between two variables and quantitates the strength of their relationship. CORRELATION evaluates only the existing data. REGRESSION uses the existing data to define a mathematical equation which can be used to predict the value of one variable based on the value of one or more other variables and can therefore be used to extrapolate between the existing data.
2 The REGRESSION equation can therefore be used to predict the outcome of observations not previously seen or tested. CORRELATION . CORRELATION provides a numerical measure of the linear or straight-line relationship between two continuous variables X and Y. The resulting CORRELATION coefficient or r value is more formally known as the Pearson product moment CORRELATION coefficient after the mathematician who first described it. X is known as the independent or explanatory variable while Y is known as the dependent or response variable.
3 A significant advantage of the CORRELATION coefficient is that it does not depend on the units of X and Y and can therefore be used to compare any two variables regardless of their units. An essential first step in calculating a CORRELATION coefficient is to plot the observations in a scattergram . or scatter plot to visually evaluate the data for a potential relationship or the presence of outlying values. It is frequently possible to visualize a smooth curve through the data and thereby identify the type of relationship present.
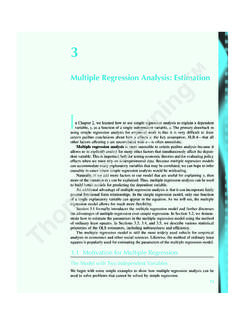
4 The independent variable is usually plotted on the X-axis while the dependent variable is plotted on the Y-axis. A perfect CORRELATION between X and Y (Figure 8-1a) has an r value of 1 (or -1). As X changes, Y. increases (or decreases) by the same amount as X, and we would conclude that X is responsible for 100% of the change in Y. If X and Y are not related at all ( , no CORRELATION ) (Figure 8-1b), their r value is 0, and we would conclude that X is responsible for none of the change in Y. Y Y Y. X X X. a) perfect linear CORRELATION b) no CORRELATION c) positive CORRELATION (r = 1) (r = 0) (0 < r < 1).
5 Y Y. X X. d) negative CORRELATION e) nonlinear CORRELATION (-1 < r < 0). Figure 8-1: Types of correlations If the data points assume an oval pattern, the r value is somewhere between 0 and 1, and a moderate relationship is said to exist. A positive CORRELATION (Figure 8-1c) occurs when the dependent variable increases as the independent variable increases. A negative CORRELATION (Figure 8-1d) occurs when the dependent variable increases as the independent variable decreases or vice versa. If a scattergram of the data is not visualized before the r value is calculated, a significant, but nonlinear CORRELATION (Figure 8-1e).
6 May be missed. Because CORRELATION evaluates the linear relationship between two variables, data which 48 / A PRACTICAL GUIDE TO BIOSTATISTICS. assume a nonlinear or curved association will have a falsely low r value and are better evaluated using a nonlinear CORRELATION method. Perfect correlations (r value = 1 or -1) are rare, especially in medicine where physiologic changes are due to multiple interdependent variables as well as inherent random biologic variation. Further, the presence of a CORRELATION between two variables does not necessarily mean that a change in one variable necessarily causes the change in the other variable.
7 CORRELATION does not necessarily imply causation. The square of the r value, known as the coefficient of determination or r2, describes the proportion of change in the dependent variable Y which is said to be explained by a change in the independent variable X. If two variables have an r value of , for example, the coefficient of determination is and we state that only 16% of the change in Y can be explained by a change in X. The larger the CORRELATION coefficient, the larger the coefficient of determination, and the more influence changes in the independent variable have on the dependent variable.
8 The calculation of the CORRELATION coefficient is mathematically complex, but readily performed by most computer statistics programs. CORRELATION utilizes the t distribution to test the null hypothesis that there is no relationship between the two variables ( , r = 0). As with any t-test, CORRELATION assumes that the two variables are normally distributed. If one or both of the variables is skewed in one direction or another, the resulting CORRELATION coefficient may not be representative of the data and the result of the t test will be invalid.
9 If the scattergram of the data does not assume some form of elliptical pattern, one or both of the variables is probably skewed (as in Figure 8-1e). The problem of non-normally distributed variables can be overcome by either transforming the data to a normal distribution or using a non-parametric method to calculate the CORRELATION on the ranks of the data (see below). As with other statistical methods, such as the mean and standard deviation, the presence of a single outlying value can markedly influence the resulting r value, making it appear artificially high.
10 This can lead to erroneous conclusions and emphasizes the importance of viewing a scattergram of the raw data before calculating the CORRELATION coefficient. Figure 8-2 illustrates the CORRELATION between right ventricular end- diastolic volume index (RVEDVI) (the dependent variable), and cardiac index (the independent variable). The CORRELATION coefficient for all data points is with the data closely fitting a straight line (solid line). From this, we would conclude that 52% (r2 = ) of the change in RVEDVI can be explained by a change in cardiac index.