Transcription of www.stata.com
1 Dendrogram Dendrograms for hierarchical cluster analysisSyntaxMenuDescriptionOptionsRema rks and examplesReferenceAlso seeSyntaxcluster dendrogram[clname][if][in][,options]opti onDescriptionMainquickdo not center parent brancheslabels(varname)name of variable containing leaf labelscutnumber(#)display top#branches onlycutvalue(#)display branches above#(dis)similarity measure onlyshowcountdisplay number of observations for each branchcountprefix(string)prefix the branch count withstring; default is n= countsuffix(string)suffix the branch count withstring; default is empty stringcountinlineput branch count in line with branch labelverticalorient dendrogram vertically (default)horizontalorient dendrogram horizontallyPlotlineoptionsaffect rendition of the plotted linesAdd plotsaddplot(plot)add other plots to the dendrogramY axis, X axis, Titles, Legend, Overalltwowayoptionsany options other thanby()documented in [G-3]twowayoptionsNote.
2 Cluster treeis a synonym forcluster addition to the restrictions imposed byifandin, the observations are automatically restricted to thosethat were used in the cluster >Multivariate analysis>Cluster analysis>Postclustering>DendrogramsDescr iptioncluster dendrogramproduces dendrograms (also called cluster trees) for a hierarchical [MV]clusterfor a discussion of cluster analysis, hierarchical clustering, and the graphically present the information concerning which observations are groupedtogether at various levels of (dis)similarity. At the bottom of the dendrogram, each observation isconsidered its own cluster. Vertical lines extend up for each observation, and at various (dis)similarityvalues, these lines are connected to the lines from other observations with a horizontal line.
3 Theobservations continue to combine until, at the top of the dendrogram, all observations are cluster dendrogram Dendrograms for hierarchical cluster analysisThe height of the vertical lines and the range of the (dis)similarity axis give visual clues about thestrength of the clustering. Long vertical lines indicate more distinct separation between the vertical lines at the top of the dendrogram indicate that the groups represented by those linesare well separated from one another. Shorter lines indicate groups that are not as Main quickswitches to a different style of dendrogram in which the vertical lines go straight up from theobservations instead of the default action of being recentered after each merge of observations inthe dendrogram hierarchy. Some people prefer this representation, and it is quicker to (varname)specifies thatvarnamebe used in place of observation numbers for labeling theobservations at the bottom of the (#)displays only the top#branches of the dendrogram.
4 With large dendrograms, thelower levels of the tree can become too crowded. Withcutnumber(), you can limit your viewto the upper portion of the dendrogram. Also see thecutvalue() (#)displays only those branches of the dendrogram that are above the#(dis)similaritymeasure. With large dendrograms, the lower levels of the tree can become too crowded. Withcutvalue(), you can limit your view to the upper portion of the dendrogram. Also see thecutnumber() that the number of observations associated with each branch be displayed belowthe most useful withcutnumber()andcutvalue()because, otherwise,the number of observations for each branch is one. When this option is specified, a label for eachbranch is constructed by using a prefix string, the branch count, and a suffix (string)specifies the prefix string for the branch count label.
5 The default iscountprefix(n=). This option implies the use of (string)specifies the suffix string for the branch count label. The default is an emptystring. This option implies the use of that the branch count be put in line with the corresponding branch branch count is placed below the branch label by default. This option implies the use of whether thexandycoordinates are to be swapped beforeplotting vertical(the default) does not swap the coordinates, whereashorizontaldoes. Plot lineoptionsaffect the rendition of the lines; see [G-3]lineoptions. Add plots addplot(plot)allows adding moregraph twowayplots to the graph; see [G-3]addplotoption. Y axis, X axis, Titles, Legend, Overall twowayoptionsare any of the options documented in [G-3]twowayoptions, excludingby(). Theseinclude options for titling the graph (see [G-3]titleoptions) and for saving the graph to disk (see[G-3]savingoption).
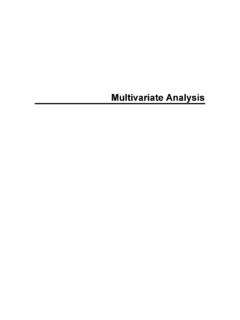
6 Cluster dendrogram Dendrograms for hierarchical cluster analysis 3 Remarks and of thecluster dendrogramcommand can be found in [MV]cluster linkage, [MV]clus-termat, [MV]cluster stop, and [MV]cluster generate. Here we illustrate some of the additionaloptions available withcluster 1 Example 1 of [MV]cluster linkageintroduces a dataset with 50 observations on four we show the dendrogram for a complete-linkage analysis:. use cluster completelinkage x1 x2 x3 x4, name(L2clnk). cluster dendrogram L2clnk, labels(labtech) xlabel(, angle(90) labsize(*.75))050100150200250L2 dissimilarity measureJenDebJenBillAlBillJenJenDebBillA lJenBillDebJenJenAlBillAlBillBillJenDebA lDebAlSamSamSamSamSamSamSamSamSamSamBill JenJenDebDebBillDebAlAlAlDebBillAlDebDen drogram for L2clnk cluster analysisThe same dendrogram can be rendered in a slightly different format by using thequickoption.
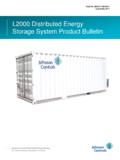
7 Cluster dendrogram L2clnk, quick labels(labtech)xlabel(, angle(90) labsize(*.75))050100150200250L2 dissimilarity measureJenDebJenBillAlBillJenJenDebBillA lJenBillDebJenJenAlBillAlBillBillJenDebA lDebAlSamSamSamSamSamSamSamSamSamSamBill JenJenDebDebBillDebAlAlAlDebBillAlDebDen drogram for L2clnk cluster analysis4 cluster dendrogram Dendrograms for hierarchical cluster analysisSome people prefer this style of dendrogram. As the name implies, this style of dendrogram is quickerto can use theifandinconditions to restrict the dendrogram to the observations for onesubgroup. This task is usually accomplished with thecluster generatecommand, which createsa grouping variable; see [MV]cluster we show the third of three groups in the dendrogram by first generating the grouping variablefor three groups and then usingifin the command forcluster dendrogramto restrict it to thethird of those three cluster gen g3 = group(3).
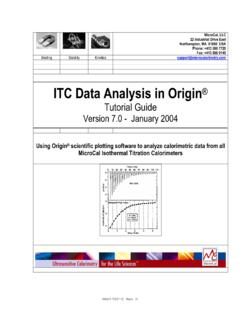
8 Cluster tree if g3==3050100150L2 dissimilarity measure3 14 31 8 30 17 48 6 42 27 22 39 41 26 33 36 37 47 9 29 24 25 28 10 Dendrogram for L2clnk cluster analysisBecause we find it easier to type, we used the synonymtreeinstead ofdendrogram. We did notspecify the cluster name, allowing it to default to the most recently performed cluster analysis. Wealso omitted thelabels()andxlabel()options, which brings us back to the default action ofshowing, horizontally, the observation example has only 50 observations. When there are many observations, the dendrogram canbecome too crowded. You will need to limit which part of the dendrogram you display. One way toview only part of the dendrogram is to useifandinto limit to one particular group, as we other way to limit your view of the dendrogram is to specify that you wish to view only thetop portion of the tree.
9 Thecutnumber()andcutvalue()options allow you to do this:cluster dendrogram Dendrograms for hierarchical cluster analysis 5. cluster tree, cutn(15) showcount050100150200250L2 dissimilarity measureG1n=3G2n=1G3n=2G4n=5G5n=1G6n=2G7n =2G8n=5G9n=5G10n=10G11n=3G12n=5G13n=3G14 n=2G15n=1 Dendrogram for L2clnk cluster analysisWe limited our view to the top 15 branches of the dendrogram withcutn(15). By default, the15 branches were labeledG1 G15. Theshowcountoption provided, below these branch labels, thenumber of observations in each of the 15 ()option provides another way to limit the view to the top branches of thedendrogram. With this option, you specify the similarity or dissimilarity value at which to trim cluster tree, cutvalue( )countprefix("(") countsuffix(" obs)") countinlineylabel(, angle(0)) horizontalG1 (3 obs)G2 (1 obs)G3 (2 obs)G4 (2 obs)G5 (3 obs)G6 (1 obs)G7 (2 obs)G8 (2 obs)G9 (5 obs)G10 (5 obs)G11 (10 obs)G12 (3 obs)G13 (5 obs)G14 (3 obs)G15 (2 obs)G16 (1 obs)050100150200250L2 dissimilarity measureDendrogram for L2clnk cluster analysisThis time, we limited the dendrogram to those branches with dissimilarity greater than byusing thecutvalue( )option.
10 There were 16 branches (groups) that met that restriction. Weused thecountprefix()andcountsuffix()options to display the number of observations in eachbranch as (#obs) instead of n=# . Thecountinlineoption puts the branch counts in line with6 cluster dendrogram Dendrograms for hierarchical cluster analysisthe branch labels. We specified thehorizontaloption and theangle(0)suboption ofylabel()to get a horizontal dendrogram with horizontal branch noteProgrammers can control the graphical procedure executed whencluster dendrogramis ability will be helpful to programmers adding new hierarchical clustering methods that requirea different dendrogram algorithm. See [MV]cluster programming subroutinesfor , M., and A. Pickles. 2010. riskplot: A graphical aid to investigate the effect of multiple categorical Journal10: 61 see[MV]cluster Introduction to cluster-analysis commands[MV]clustermat Introduction to clustermat commands