Transcription of Title stata.com graph box — Box plots
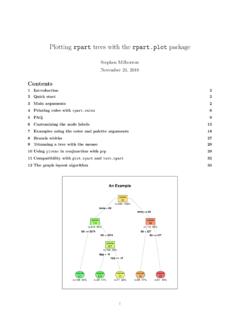
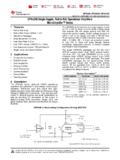
1 Box Box plotsDescriptionQuick startMenuSyntaxOptionsRemarks and examplesMethods and formulasReferencesAlso seeDescriptiongraph boxdraws vertical box plots . In a vertical box plot , theyaxis is numerical, and thexaxisis graph boxy1 y2, over(cat_var)y8ooy1,y2must be numeric;6statistics are shown ontheyaxis--4--cat_varmay be numericor string; it is shownon categoricalxaxis2oxfirst secondgroup groupThe encoding and the words used to describe the encoding areo <-outside valuesoadjacent line<-upper adjacent valuewhiskers<-75th percentile (upper hinge)box<-median<-25th percentile (lower hinge)whiskersadjacent line<-lower adjacent valueo <-outside valuegraph hboxdraws horizontal box plots . In a horizontal box plot , the numerical axis is still calledtheyaxis, and the categorical axis is still called thexaxis, butyis presented horizontally, box Box plots . graph hboxy1 y2, over(cat_var)x|ofirstgroup|same conceptual layoutas forgraph box:y1,y2appear onyaxiso|cat_varappears onxaxissecondgroup|oy2 4 6 8 Quick startBox plot ofv1graph box v1 Add boxes forv2andv3graph box v1 v2 v3As above, but as a horizontal box plotgraph hbox v1 v2 v3 Box plots forv1andv2at each level of categorical variablecatvar1graph box v1 v2, over(catvar1)Add a box showing the overall box plots ofv1andv2over all levels ofcatvar1graph box v1 v2, over(catvar1, total)Boxes for each level ofcatvar1grouped by levels ofcatvar2graph box v1, over(catvar1) over(catvar2)As above, but with levels ofcatvar2grouped by levels ofcatvar1graph box v1, over(catvar2) over(catvar1)A separate graph area for each level ofcatvar2graph box v1 v2, by(catvar2)As above, but with separate boxes for each category ofcatvar1within each graph areagraph box v1, over(catvar1) by(catvar2)Change the labels for the boxes to Group 1 and Group 2 graph box v1, over(catvar1, relabel(1 "Group 1" 2 "Group 2"))
2 graph box Box plots 3 MenuGraphics>Box plotSyntaxgraph boxyvars[if][in][weight][,options] graph hboxyvars[if][in][weight][,options]where yvarsis avarlistoptionsDescriptiongroupoptionsgr oups over which boxes are drawnyvaroptionsvariables that are the boxesboxlookoptionshow the boxes looklegendingoptionshow variables are labeledaxisoptionshow numericalyaxis is labeledtitleandotheroptionstitles, added text, aspect ratio, (varname[,oversubopts])categories; option may be repeatednofillomit empty categoriesmissingkeep missing value as categoryallcategoriesinclude all categories in the datasetyvaroptionsDescriptionascategoryt reatyvarsas firstover()groupasyvarstreat firstover()group asyvarscwcalculate variable statistics omitting missing values of anyvariable4graph box Box plotsboxlookoptionsDescriptionnooutsides do not plot outside valuesbox(#,barlookoptions)look of#th boxpcycle(#)box styles before pstyles recycleintensity([*]#)intensity of filllintensity([*]#)intensity of outlinemedtype(line|cline|marker)how median is indicated in boxmedline(lineoptions)look of line ifmedtype(cline)medmarker(markeroptions) look of marker ifmedtype(marker)cwhiskersuse custom whiskerslines(lineoptions)look of custom whiskersalsize(#)width of adjacent line; default is 67capsize(#)height of cap on adjacent line.
3 Default is 0marker(#,markeroptionslook of#th marker and label for outside valuesmarkerlabeloptions)outergap([*]#)g ap between edge and first box and between last box and edgeboxgap(#)gap between boxes; default is 33legendingoptionsDescriptionlegendoptio nscontrol ofyvarlegendnolabeluseyvarnames, not labels, in legendyvaroptions(oversubopts)oversubopt sforyvars; seldom specifiedshowyvarslabelyvarsonxaxis; seldom specifiedaxisoptionsDescriptionyalternat eput numericalyaxis on right (top)xalternateput categoricalxaxis on top (right)yreversereverseyaxisaxisscaleopti onsy-axis scaling and lookaxislabeloptionsy-axis labelingytitle(..)y-axis titlinggraph box Box plots 5titleandotheroptionsDescriptiontext(..) add text on graph ;xrange[0, 100]yline(..)addylines to graphaspectoptionconstrain aspect ratio of plot regionstdoptionstitles, graph size, saving to diskby(varlist,..)repeat for subgroupsTheoversubopts used inover(varname,oversubopts)and, on rare occasion, inyvarop-tions(oversubopts) areoversuboptsDescriptiontotaladd total grouprelabel(#"text".)
4 Change axis labelslabel(cataxislabeloptions)renditio n of labelsaxis(cataxislineoptions)rendition of axis linegap([*]#)gap between boxes withinover()categorysort(varname)put boxes in prespecified ordersort(#)put boxes in median orderdescendingreverse default or specified box orderaweights,fweights, andpweights are allowed; see[U] weightand see note concerningweights in [D] are presented under the following headings:groupoptionsyvaroptionsboxlooko ptionslegendingoptionsaxisoptionstitlean dotheroptionsSuboptions for use with over( ) and yvaroptions( )groupoptionsover(varname[,oversubopts]) specifies a categorical variable over which theyvarsare to be string or numeric. Up to twoover()options may be specified whenmultipleyvarsare specified, and up to threeover()s may be specified when oneyvaris specified;seeExamples of syntaxunderRemarks and that missing subcategories be omitted. See the description of thenofilloption in[G-2] graph box Box plotsmissingspecifies that missing values of theover()variables be kept as their own categories, onefor.
5 , another , etc. The default is to ignore such observations. Anover()variable isconsidered to be missing if it is numeric and contains a missing value or if it is string and contains .allcategoriesspecifies that all categories in the entire dataset be retained for theover() specified withoutallcategories, the graph is drawn, completely excludingany categories for theover()variables that do not occur in the specified subsample. With theallcategoriesoption, categories that do not occur in the subsample still appear in the legend, andzero-height bars are drawn where these categories would appear. Such behavior can be convenientwhen comparing graphs of subsamples that do not include completely common categories for allover()variables. This option has an effect only wheniforinis specified or if there are missingvalues in the not be combined withby().yvaroptionsascategoryspecifies that theyvarsbe treated as the firstover()group. The important effect ofthis is to move the captioning of the variables from the legend to the categoricalxaxis.
6 See thedescription ofascategoryin [G-2] graph that the firstover()group be treated asyvars. The important effect of this isto move the captioning of the first over group from the categoricalxaxis to the legend. See thedescription ofasyvarsin [G-2] graph casewise deletion. Ifcwis specified, observations for which any of theyvarsare missingare ignored. The default is to calculate statistics for each box by using all the data that the outside values not be plotted or used in setting the scale of (#,barlookoptions)specifies the look of (1,..)refers to the boxassociated with the firstyvar,box(2,..)refers to the box associated with the second, and specifybarlookoptions. Those options are borrowed fromgraph barfor boxes. The mostusefulbarlookoptioniscolor(colorstyl e), which sets the color and opacity of the box. Forinstance, you might specifybox(1, color(green))to make the box associated with the firstyvargreen.
7 See [G-4]colorstylefor a list of color choices and see [G-3]barlookoptionsforinformation on the (#)specifies how many variables are to be plotted before the pstyle (see [G-4]pstyle) ofthe boxes for the next variable begins again at the pstyle of the first variable p1box(with theboxes for the variable following that usingp2boxand so on). Put another way:#specifies howquickly the look of boxes is recycled when more than#variables are specified. The default formost schemes ispcycle(15).intensity(#)andintensity(*# )specify the intensity of the color used to fill the inside of (#)specifies the intensity, andintensity(*#)specifies the intensity relative tothe default, the box is filled with the color of its border, attenuated. Specifyintensity(*#),#<1, to attenuate it more and specifyintensity(*#),#>1, to amplify box Box plots 7 Specifyintensity(0)if you do not want the box filled at all. If you are using a scheme that drawsthe median line in the background color such ass2mono, also specify optionmedtype(line)tochange the median line to be in the color of the outline of the (#)andlintensity(*#)specify the intensity of the line used to outline the (#)specifies the intensity, andlintensity(*#)specifies the intensity relative tothe default, the box is outlined at the same intensity at which it is filled or at an amplificationof that, which depending on your chosen scheme; see [G-4]Schemes intro.
8 If you want the boxoutlined in the darkest possible way, specifyintensity(255). If you wish simply to amplifythe outline, specifyintensity(*#),#>1, and if you wish to attenuate the outline, specifyintensity(*#),#< (),medline(), andmedmarker()specify how the median is to be indicated in the (line)is the default. A line is drawn across the box at the median. Here optionsmedline()andmedmarker()are (cline)specifies a custom line be drawn across the box at the median. The defaultcustom line is usually a different color. You can, however, specify optionmedline(lineoptions)to control exactly how the line is to look; see [G-3] (marker)specifies a marker be placed in the box at the median. Here you may also specifyoptionmedmarker(markeroptions)to specify the look of the marker; see [G-3] ,lines(lineoptions),alsize(#), andcapsize(#)specify the look of the that custom whiskers are desired. The default custom whiskers are usuallydimmer, but you may specify optionlines(lineoptions)to specify how the custom whiskersare to look; see [G-3] (#)andcapsize(#)specify the width of the adjacent line and the height of the cap on theadjacent line.
9 You may specify these options whether or not you ()andcapsize()are specified in percentage-of-box-width units; the defaults arealsize(67)andcapsize(0). Thus the adjacent lines extend two-thirds the width of a box and, by default, haveno caps. Caps refer to whether the whiskers look likethisor this--If you want caps, trycapsize(5).marker(#,markeroptions markerlabeloptions)specifies the marker and label to be used todisplay the outside values. See [G-3]markeroptionsand [G-3] (*#)andoutergap(#)specify the gap between the edge of the graph to the beginningof the first box and the end of the last box to the edge of the (*#)specifies that the default be modified. Specifyingoutergap(* )increases thegap by 20%, and specifyingoutergap(*.8)reduces the gap by 20%.outergap(#)specifies the gap as a percentage-of-box-width (50)specifies thatthe gap be half the box box Box plotsboxgap(#)specifies the gap to be left betweenyvarboxes as a percentage-of-box-width units.
10 Thedefault isboxgap(33).boxgap()affects only theyvarboxes. If you want to change the gap for the first, second, or thirdover()group, specify theoversuboptgap()inside theover()itself; seeSuboptions for usewith over( ) and yvaroptions( ) you to control the legend. If more than oneyvaris specified, a legend isproduced. Otherwise, no legend is needed because theover()groups are labeled on the categoricalxaxis. See [G-3]legendoptions, and seeTreatment of multiple yvars versus treatment of over( )groupsunderRemarks and that, in automatically constructing the legend, the variable names of theyvarsbeused in preference to their (oversubopts)allows you to specifyoversuboptsfor theyvars. This is seldom that, in addition to building a legend, the identities of theyvarsbe shown onthe categoricalxaxis. Ifshowyvarsis specified, it is typical to also specifylegend(off).axisoptionsyalternate andxalternateswitch the side on which the axes withgraph box,yalternatemoves the numericalyaxis from the left to the right;xalternatemoves the categoricalxaxis from the bottom to the withgraph hbox,yalternatemoves the numericalyaxis from the bottom to the top;xalternatemoves the categoricalxaxis from the left to the your scheme by default puts the axes on the opposite sides, thenyalternateandxalternatereverse their that the numericalyaxis have its scale reversed so that it runs from maximumto how the numericalyaxis is scaled and how it looks; see[G-3]axisscaleoptions.