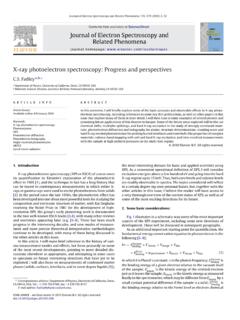
Transcription of X-Ray Photoelectron Spectroscopy (XPS) - …
1 Electron Spectroscopy for Chemical Analysis (ESCA) X-Ray PhotoelectronSpectroscopy (XPS)Louis ~scudiero; 5-2669 The basic principleof the photoelectric effect was enunciated by Einstein [1] in 1905E = h There is a threshold in frequency below which light, regardless of intensity, fails to eject electrons from a metallic surface. h c> e mWhere h - Planck constant ( x 10-34 J s ), frequency (Hz) of the radiation and m work function In Photoelectron Spectroscopy such XPS, Auger and UPS, the photon energies range from 20 -1500 eV (even higher in the case of Auger, up to 10,000eV) much greater than any typical work function values (2-5 eV). In these techniques, the kinetic energy distribution of the emitted photoelectrons ( the number of emitted electrons as a function of their kinetic energy) can be measured using any appropriate electron energy analyzer and a Photoelectron spectrum can thus be recorded.
2 [1] Eintein A. Ann. Physik1905, 17, 132. By using photo-ionization and energy-dispersive analysis of the emitted photoelectrons the composition and electronic state of the surface region of a sample can be studied. Traditionally, these techniques have been subdivided according to the source of exciting radiation into : X-Ray Photoelectron Spectroscopy (XPS or ESCA) - using soft X-Ray (200 - 1500 eV) radiation to examine core-levels. Ultraviolet Photoelectron Spectroscopy (UPS) - using vacuum UV (10 -45 eV) radiation to examine valence levels. Auger Electron Spectroscopy (AES or SAM) using energetic electron (1000 10,000 eV) to examine core-levels. Synchrotron radiation sources have enabled high resolution studies to be carried out with radiation spanning a much wider and more complete energy range ( 5 - 5000+ eV ) but such work will remain, a very small minority of all Photoelectron studies due to the expense, complexity and limited availability of such sources (Berkeley, Stanford, New York (2), Baton Rouge, Argonne in the US).
3 One way to look at the overall Photoelectron process is as follows :A + hv= A++ e-1. Conservation of energy then requires that : E(A) + hv= E(A+) + E(e-) (energy is conserved)2. Since the energy of the electron is present solely as kinetic energy (KE) this can be rearranged to give the following expression for the KE of the Photoelectron : E(e-)= KE(e-) = hv [E(A+) - E(A)]3. The final term in brackets represents the difference in energy between the ionized and neutral atoms, and is generally called the binding energy(BE) of the electron - this then leads to the following commonly quoted equation : KE = hv-BE0 eV2p 1 sValence LevelsFermi SurfaceCore LevelsVacuumE2 s sPhotoelectron: BE = h - KE orPhotoelectronsor s-Energy Diagram Eb(binding energy) is below the conduction band edge.
4 Fermi energies of metal and spectrometer coincide (electrons transfer between metal and spectrometer until the EFalign). Contact potential; e( - sp). E k:measured kinetic energy. Eb = h -E k e sp (no need to know the work function of the sampleEFContact PotentialX-ray Sources Their choice is determined by the energy resolution. Typical materials are Mg and Al. A heated filament (cathode) emits electrons which are accelerated toward a solid anode (water cooled) over a potential of the order of 5 -20 kV. Holes are formed in the inner levels of the anode atoms by the electron bombardment and are then radioactively filled by transitions from higher-lying levels:2p 3/21s 2p 1/21sResulting in the emission of X-raysMg K 1, 2at eVAl K 1, 2at eVTypical geometry of an X-Ray gunIncident beam E = h Escaped Si K X-Ray (~ keV)Aluminum windows of 10-30 m thick separate the excitation region from the specimen.)
5 Additional X-Ray lines (K 3and K 4) and a continuous spectrum (Bremsstrahlung) are produced. Peaks 10 eV above the K 1, 2with intensities of 8 % and 4 % of K 1, 2and a continuous spectrum contribute to the BG. Typical emission of X-raysX-ray Sources AvailableX-raysEnergy (eV)Natural Width (eV)Cu K K K K K and PHI commonly use AlK and MgK To remove the unwanted radiation and increase the energy resolution theAlK is often monochromatized (cut a slice from the X-Ray energyspectrum, removing both satellites and Bremstrahlung (which increases theBG level). Crystal used= quartz because can be obtained in near perfect form and can be elastically bent (bending does not affect resolution or reflectivity).For first order (n =1) diffraction and Al K X-rays, = for a distance d between planes of about 4 and a Bragg angle, of Beam (2) travels an extra dsin before reaching the surface and beam (1)Parallel Atomic Planes n =2dsin( )ddsin (1)(2)Rowland circleThe crystal must lie along the circumference of the Rowland circle (focusing circle), Johannfocusing Cu K ( ~ )AnalyzersersKEVd2=Dispersive analysis of the kinetic energy spectrum n(KE)The parallel plate electrostatic analyzerA field is applied between 2 parallel plates, distance s apart.)
6 The lower plate has slits a distance r apart (entrance and exit slits). The photoelectrons with kinetic energy KE are transmitted to the detector. By varying Vdthe spectrum of electron kinetic energies can thus be obtained. KE is proportional to Vdtherefore the plot of electron flux at the detector against V is the photoemission alternative to dispersive analysis is to discriminate the electron KE by a retarding electric field applied between the target region and the detector. Electrons with KE > eVrwill reach the detector (a kind of filtration process).Spherical mirror ionization process has a rather low absolute probability (104electrons per second, or 10-15 A) therefore electron multiplier (gain of 10 6) are used to obtain an accurately measurable current.
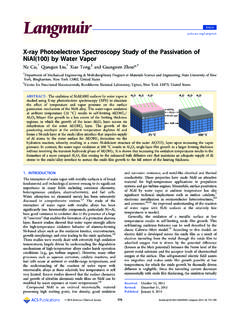
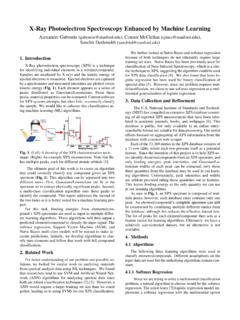
7 Newer instruments use channel of energy vacuum system software and computer12345 Immediate identificationof the chemical composition of the Wide Energy ScanThe core electron binding energies (BE) of the elements are distinctiveWashington State University--Pullman, WANameO 1sC 1sSi (Auger)O 1sC 1sSi 2px 103102030405060708090 CPS10008006004002000 Binding Energy (eV)Typical High Resolution SpectraHigh-resolutionacquisition scans yield information such as Chemical shifts Multiplet structure Satellites Chemical bonding XPS is very surface sensitive because only electrons from the top few atomic layers (mean free path ~ nm) can escape without loss of energy. The absorption length of the X-rays is about 100 nm to 1000 nm. Surface Sensitive TechniqueUniversal CurveAXIS-165 multi-electron spectrometerFrom Kratos analytical sample placed in ultra-high vacuum is irradiated with photons of energy (h ); soft x-rays.
8 Atoms on the surface emit electrons (photoelectrons) after direct transfer of energy from the photons to the core-level process can be summarized as follows:1. A bound electron adsorbs the photon, converting some of its energy into kinetic As the electron leaves the atom some of its energy is used to overcome the Coulomb attraction of the nucleus, reducing its KE by its initial state At the same time the outer orbitals readjust, lowering the energy of the final state that is being created and giving this additional energy to the outgoing electron. = hPhotoelectric effectThe 3 step of electron to the surface (diffusion energy loss) into the vacuumVacuumSolideh electron1 Excitation2 Diffusion energy loss3 EscapeeEinstein:The optical excitation probability is given by the photoionization cross-section (E)In quantum mechanics (E) in a subshell nl (principal and orbital quantum numbers)is given by])1(][121][[34)(1,21,2,,202,+ +++ =lElElnlnlnRllRlEENaE : fine structure constant 1/137, a0 Bohr radius ( nm), Nn,l: number ofein the subshell,En,ltheenergy of thenlelectrons,E.
9 KE of the ejected n =1 and l =0 The radial dipole matrix elements are = 01,,1,)()(drrrPrPRlElnlEPnl(r)1/r and PE,l 1(r)1/r are the radial parts of the single-particle wave functions of the initial(discrete) and final (continuum) states, H, P10(r)=(1/ a0)3/22exp(-r/ a0).10,E20,10,12020,1R]EE[Na34)E(+ = Cooper Minimum:RE,l-1<< RE, l+1, thus RE, l+1will give the basic features and the energydependence of the cross-sections. For a radial wavefunction with nodes, RE, l+1will gothrough 0 at a particular energy, giving rise to a minimum in the cross-section .Near photoionization threshold: RE, l+1goes through 0 because1. Final state (emitted) electron wavefunction is largely excluded from the core region2. Initial state electron wavefunction has most strength, after it goes through a the photon energy increases the final state electron wavefunction begins to penetrate thecore and the overlap goes to 0 due to the node in the initial state : Cooper Minima in the Photoemission Spectra of Solids, Molodtsov et al.
10 Example: Copper (Cu+) versus Silver (Ag+) Increase or decrease of the PE signal of certain states)]1cos3(41[4)( totalIPhotoemission intensity( : asymmetry parameter, : take off angle and total the total cross-section)References Surface Analysis, The Principal Techniques Edited by John C. Vickerman, John Wiley &Sons (1997). Handbook X-Ray and ultraviolet Photoelectron Spectroscopy , Briggs, Heyden &Son Ltd (1977). Solid State Chemistry: Techniques, A. K. Cheetham and Peter Day, Oxford Science Publication (1987). Practical Surface Analysis by D. Briggs and M. P.