1 Why is multiple testing a problem?
mgoldman@stat.berkeley.edu O ce Hours: 342 Evans M 10-11, Th 3-4, and by appointment 1 Why is multiple testing a problem? Say you have a set of hypotheses that you wish to test simultaneously. The rst idea that might come to mind is to test each hypothesis separately, using some level of signi cance .
Download 1 Why is multiple testing a problem?

Information
Domain:
Source:
Link to this page:
Documents from same domain
One Hundred Solved Exercises for the subject: …
www.stat.berkeley.eduOne Hundred1 Solved2 Exercises3 for the subject: Stochastic Processes I4 ... If the probability of rain is p, what is the probability that I get wet? 2.

International Relations Theory and the End of the …
www.stat.berkeley.eduInternational Relations Theory and the End of the Cold War Author(s): John Lewis Gaddis ... out of efforts to construct theories of international relations. There is a very simple reason for this: visions of any future have to proceed from the awareness of some kind of past; otherwise there can be no ...
Sampling - Department of Statistics
www.stat.berkeley.edusample” consists of the people willing to be interviewed on certain days at certain shopping centers. This too is a convenience sample. The reason This too is a convenience sample. The reason
Computing in the Statistics Curricula
www.stat.berkeley.educomputational problems and vocabulary into traditional statistics courses. 1.2 Our Backgrounds We have been thinking about and working on making changes in these directions for several years.
Brownian Motion and An Introduction to Stochastic Integration
www.stat.berkeley.eduBrownian Motion and An Introduction to Stochastic Integration Arturo Fernandez University of California, Berkeley Statistics 157: Topics In Stochastic Processes Seminar
Introduction to Time Series Analysis. Lecture 1.
www.stat.berkeley.eduIntroduction to Time Series Analysis. Lecture 1. Peter Bartlett 1. Organizational issues. 2. Objectives of time series analysis. ... Time Series Analysis and its Applications. With R Examples, Shumway and Stoffer. 2nd Edition. 2006. 2. ... Forecasting. Example: Predict unemployment. 4. Control. Example: Impact of …
Lecture Notes for Introductory Probability
www.stat.berkeley.eduLecture Notes for Introductory Probability Janko Gravner Mathematics Department University of California Davis, CA 95616 ... The theory of probability has always been associated with gambling and many most accessible ... The probability of this is 4 times the probability …

Conservative statistical post-election audits - Berkeley
www.stat.berkeley.eduthat requires post-election audits of randomly selected precincts, “to ensure with at least 99% statistical power that for each federal, gubernatorial or other Statewide election held in the State, a 100% manual recount of the voter-verifiable paper
Introduction to SQL - Department of Statistics
www.stat.berkeley.eduIntroduction to SQL What is SQL? I Structured Query Language I Usually “talk” to a database server I Used as front end to many databases (mysql, postgresql, oracle, sybase) I Three Subsystems: data description, data access and privileges I Optimized for certain data arrangements I The language is case-sensitive, but I use upper case for keywords.

Reversible Markov Chains and Random Walks on Graphs
www.stat.berkeley.eduReversible Markov Chains and Random Walks on Graphs David Aldous and James Allen Fill Un nished monograph, 2002 (this is recompiled version, 2014)
Related documents
Logistic Regression
personal.psu.eduLogistic Regression I The Newton-Raphson step is βnew = βold +(XTWX)−1XT(y −p) = (XTWX)−1XTW(Xβold +W−1(y −p)) = (XTWX)−1XTWz , where z , Xβold +W−1(y −p). I If z is viewed as a response and X is the input matrix, βnew is the solution to a weighted least square problem: βnew ←argmin β (z−Xβ)TW(z−Xβ) . I Recall that linear regression by least square is …
Data, Covariance, and Correlation Matrix
users.stat.umn.eduThe Data Matrix R Code Row and Column Means > # get row means (3 ways) > rowMeans(X)[1:3] Mazda RX4 Mazda RX4 Wag Datsun 710 29.90727 29.98136 23.59818
The Adaptive Lasso and Its Oracle Properties
users.stat.umn.eduof Minnesota, Minneapolis, MN 55455 (E-mail: hzou@stat.umn.edu ). The au-thor thanks an associate editor and three referees for their helpful comments and suggestions. Sincere thanks also go to a co-editor for his encouragement. high variability and in addition is often trapped into a local op-timal solution rather than the global optimal solution.

Principal Component Analysis - Columbia University
www.stat.columbia.eduPCA in a nutshell Notation I x is a vector of p random variables I k is a vector of p constants I 0 k x = P p j=1 kjx j Procedural description I Find linear function of x, 0 1x with maximum variance. I Next nd another linear function of x, 0 2x, uncorrelated with 0 1x maximum variance. I Iterate. Goal It is hoped, in general, that most of the variation in x will be

Missing-data imputation
www.stat.columbia.edu530 MISSING-DATA IMPUTATION 25.1 Missing-data mechanisms To decide how to handle missing data, it is helpful to know why they are missing. We consider four general “missingness mechanisms,” moving from the simplest to
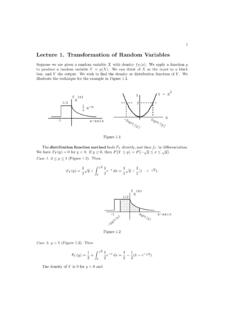
Lecture1.TransformationofRandomVariables
faculty.math.illinois.edu7 2.3ATypicalApplication Let Xand Ybe independent,positive random variables with densitiesf X and f Y,and let Z= XY.We find the density of Zby introducing a new random variable W,as follows: Z= XY, W= Y (W= Xwould be equally good).The transformation is one-to-one because we can solve for X,Yin terms of Z,Wby X= Z/W,Y= W.In a problem of this type,we must always
Generalized Estimating Equations - SAS
support.sas.comSAS/STAT software provides two procedures that enable you to perform GEE analysis: the GENMOD procedure and the GEE procedure. Both procedures implement the standard generalized estimating equation approach for longitudinal data; this approach is appropriate for complete data or when data are missing completely

Type I and Type II errors - Department of Statistics
www.stat.berkeley.eduThe q-value is defined to be the FDR analogue of the p-value. The q-value of an individual hypothesis test is the minimum FDR at which the test may be called significant.