
154-2010: Using PROC SGPLOT for Quick High …
1 Paper 154-2010 Using PROC SGPLOT for Quick High-Quality Graphs Susan J. Slaughter, Avocet Solutions, Davis, CA Lora D. Delwiche, University of California, Davis, CA
Download 154-2010: Using PROC SGPLOT for Quick High …

Information
Domain:
Source:
Link to this page:
Documents from same domain

027-2009: Tips and Tricks for Creating the Reports …
support.sas.comPaper 027-2009 TIPS AND TRICKS FOR CREATING THE REPORTS YOUR CLIENTS NEED TO SEE Michael J Molter, INC Research, Raleigh, NC ABSTRACT Advanced reporting tools such as PROC REPORT have progressed by leaps and …

Step-by-Step Programming with Base SAS Software
support.sas.comThe correct bibliographic citation for this manual is as follows: SAS Institute Inc. 2001. Step-by-Step Programming with Base SAS® Software.Cary, NC: SAS Institute Inc.

227-2012: Executing a PROC from a DATA Step - …
support.sas.com2 Using RUN_MACRO to execute a PROC from a DATA step requires writing three blocks of code, described in the Introduction: a macro to execute a PROC, a user-written function to execute the macro, and a DATA step to call the

149-2012: Queries, Joins, and WHERE Clauses, Oh …
support.sas.comPaper 149-2012 Queries, Joins, and WHERE Clauses, Oh My!! Demystifying PROC SQL Christianna S. Williams, Chapel Hill, NC ABSTRACT Subqueries, inner joins, outer joins, HAVING expressions, set operators…just the terminology of PROC SQL might

158-2010: How to Use Arrays and DO Loops: Do I …
support.sas.com1 Paper 158-2010 How to Use ARRAYs and DO Loops: Do I DO OVER or Do I DO i? Jennifer L Waller, Medical College of Georgia, Augusta, GA ABSTRACT

248-2009: Learning When to Be Discrete: …
support.sas.com1 Paper 248–2009 Learning When to Be Discrete: Continuous vs. Categorical Predictors David J. Pasta, ICON Clinical Research, San Francisco, CA ABSTRACT

338-2011: An Introduction to Survival Analysis …
support.sas.com2 (Censored) Study Ends (From Applied Survey Data Analysis, p. 306) Figure 1. Prospective View of Event History Survey Data Time can be regarded as continuous or discrete and this basic distinction affects the analytic approach selected.

Dongsheng Yang and Jarrod E. Dalton - SAS
support.sas.com1 Paper 335-2012 A unified approach to measuring the effect size between two groups using SAS® Dongsheng Yang and Jarrod E. Dalton Departments of Quantitative Health Sciences and Outcomes Research

SAS/STAT 9.2 User's Guide: Introduction to Power …
support.sas.comSAS/STAT ® 9.2 User’s Guide Introduction to Power and Sample Size Analysis (Book Excerpt) SAS® Documentation

249-2012: A Tutorial on the SAS® Macro Language
support.sas.com1 Paper 249-2012 A Tutorial on the SAS® Macro Language John J. Cohen, Advanced Data Concepts LLC, Newark, DE ABSTRACT The SAS macro language is another language layering on top of regular SAS code.
Related documents
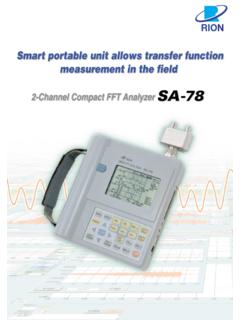
SA-78 Display Screen Examples - Scantek, Inc
scantekinc.comDirect connection of microphone or accelerometer possible. (Using CCLD type microphone preamplifier NH-22) 2-channel input allows easy transfer function measurement in the field. Support for FFT processing and octave analysis (synthesized). Upper frequency limit of 80 kHz enables ultrasound analysis. Measurement results and waveform data …
TABLES, CHARTS AND GRAPHS - …
www.surgicalcriticalcare.netTABLES, CHARTS, AND GRAPHS / 75 CHAPTER TWELVE TABLES, CHARTS, AND GRAPHS Tables, charts, and graphs are frequently used in statistics to visually communicate data. Such illustrations are also a frequent first step in evaluating raw data for trends, data entry errors, and outlying
Practical Rules for Using Color in Charts - …
www.perceptualedge.comPractical Rules for Using Color in Charts Stephen Few
Using Graphs to Display Data - WHA Quality Center
www.whaqualitycenter.org(R 2-12) WHA Quality Center Source: http://math.youngzones.org/stat_graph.html Bar graph A bar graph displays discrete data in separate columns.

II-12Graphs - WaveMetrics
www.wavemetrics.netChapter II-12 — Graphs II-213 data readouts as you glide the cursors through your data (see Info Panel and Cursors).You can edit your data graphically (see Drawing and Editing Waves). Igor graphs are fast.
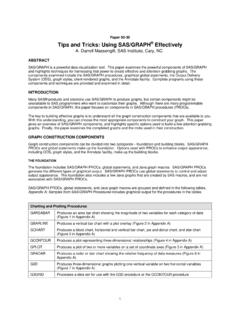
Paper 90-30 Tips and Tricks: Using SAS/GRAPH …
support.sas.com1 Paper 90-30 Tips and Tricks: Using SAS/GRAPH® Effectively A. Darrell Massengill, SAS Institute, Cary, NC ABSTRACT SAS/GRAPH is a powerful data visualization tool.
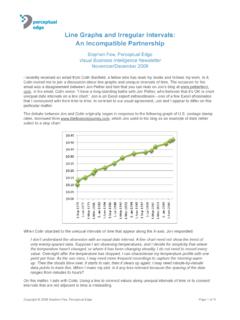
Line Graphs and Irregular Intervals - Perceptual Edge
www.perceptualedge.comLine Graphs and Irregular Intervals Stephen Few
Using Excel for Handling, Graphing, and Analyzing ...
academic.pgcc.eduUsing Excel for... Scientific Data 1 Using Excel for Handling, Graphing, and Analyzing Scientific Data Excel is a Microsoft computer application called a “spreadsheet.” It is designed to manage, manipulate, and display data. It has functions appropriate for business
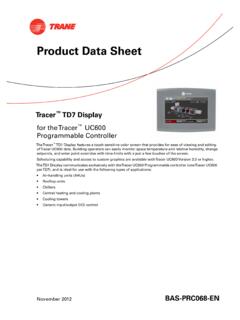
Product Data Sheet - Trane
www.trane.comNovember 2012 BAS-PRC068-EN Product Data Sheet Tracer™TD7 Display for theTracer™ UC600 Programmable Controller TheTracer™TD7 Display features a touch-sensitive color screen that provides for ease of viewing and editing ofTracer UC600 data. Building operators can easily monitor space temperature and relative humidity, change
Related search queries
Display, Using, Data, TABLES, CHARTS AND GRAPHS, TABLES, CHARTS, AND GRAPHS, TABLES, CHARTS, AND GRAPHS Tables, charts, and graphs, Practical Rules for Using Color, Using Graphs to Display Data, II-12Graphs, Graphs, Tricks: Using SAS/GRAPH, Tricks: Using SAS/GRAPH® Effectively, Line Graphs and Irregular Intervals, For Handling, Graphing, and Analyzing, For Handling, Graphing, and Analyzing Scientific Data, Display data, Product Data Sheet, Trane