BASIC CALCULUS REFRESHER
Ismor Fischer, Ph.D. Dept. of Statistics UW-Madison 1. Introduction. This is a very condensed and simplified version of basic calculus, which is a prerequisite for many courses in Mathematics, Statistics, Engineering, Pharmacy, etc. It is not comprehensive, and
Download BASIC CALCULUS REFRESHER

Information
Domain:
Source:
Link to this page:
Documents from same domain
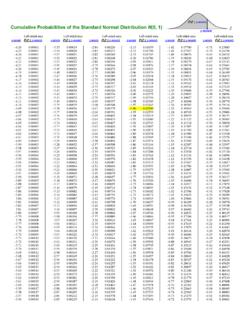
P(Z Cumulative Probabilities of the Standard …
pages.stat.wisc.eduCumulative Probabilities of the Standard Normal Distribution N(0, 1) Left-sided area Left-sided area Left-sided area Left-sided area Left-sided area Left-sided area
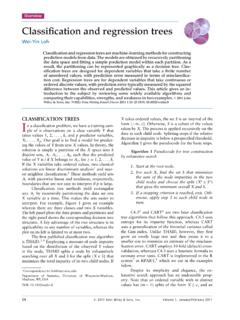
Classification and regression trees
pages.stat.wisc.eduOverview Classification and regression trees Wei-Yin Loh Classificationandregressiontreesaremachine-learningmethodsforconstructing predictionmodelsfromdata ...
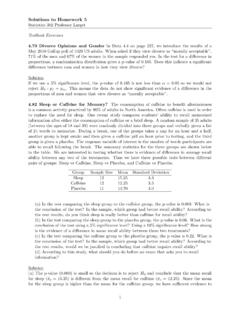
Solutions to Homework 5 Statistics 302 Professor Larget
pages.stat.wisc.eduSolutions to Homework 5 Statistics 302 Professor Larget Textbook Exercises 4.79 Divorce Opinions and Gender In Data 4.4 on page 227, we introduce the results of a May 2010 Gallup poll of 1029 US adults. When asked if they view divorce as \morally acceptable", 71% of the men and 67% of the women in the sample responded yes. In the test for a di ...
Using lme4: Mixed-Effects Modeling in R
pages.stat.wisc.eduDe nition of linear mixed-e ects models A mixed-e ects model incorporates two vector-valued random variables: the response, Y, and the random e ects, B. We observe the value, y, of Y. We do not observe the value of B. In a linear mixed-e ects model the conditional distribution, YjB, and the marginal distribution, B, are independent,
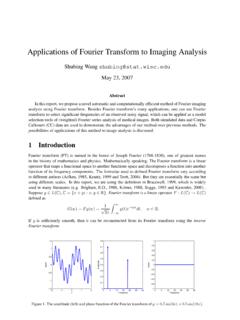
Applications of Fourier Transform to Imaging Analysis
pages.stat.wisc.eduCallosum (CC) data are used to demonstrate the advantages of our method over previous methods. The possibilities of applications of this method to image analysis is discussed. 1 Introduction Fourier transform (FT) is named in the honor of Joseph Fourier (1768-1830), one of greatest names in the history of mathematics and physics.
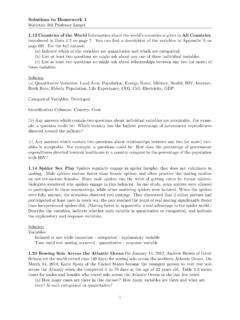
Solutions to Homework 1 Statistics 302 Professor Larget
pages.stat.wisc.eduselected. Other options are possible: for example, we could number the plants from 1 to 30000 and randomly select 30 numbers between 1 and 30000. (b) Answers will vary for this question, but the procedure should be explained and the three numbers which were obtained should be listed. Here is the start of one sample. Row Plant #94 #180 #83 # 81 ...
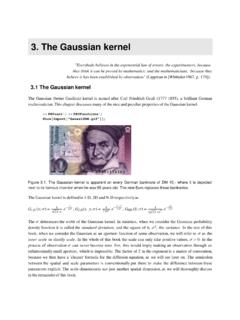
3. The Gaussian kernel
pages.stat.wisc.eduThe Gaussian kernel is defined in 1-D, 2D and N-D respectively as ... process of observation s can never become zero. For, this would imply making an observation through an infinitesimally small aperture, which is impossible. The factor of 2 in the exponent is a matter of convention,
CHAPTER 8. RANDOMIZED COMPLETE BLOCK DESIGN …
pages.stat.wisc.eduMSEB is the mean square of design-B with degrees of freedom dfB. If RE>1, design A is more efficient. If RE<1, the converse is true. If a randomized complete block design (say, design-A) is used, one may want to estimate the relative efficiency compared with a completely randomized design (say, design-B).
Practice Exam Questions; Statistics 301; Professor Wardrop
pages.stat.wisc.edu13. A sample space has three possible outcomes, B, C, and D. It is known that P(C) = P(D). The operation of the chance mechanism is simulated 10,000 times (runs). The sorted frequencies of the three outcomes (B, C, and D) are: 2322, 2360, and 5318. (a) What is your approximation of P(B)? To receive credit you must explain your an-swer.
Power and Sample Size Determination
pages.stat.wisc.eduPower and Sample Size Determination Bret Hanlon and Bret Larget Department of Statistics University of Wisconsin|Madison November 3{8, 2011 Power 1 / 31 Experimental Design To this point in the semester, we have largely focused on methods to analyze the data that we have with little regard to the decisions on how to gather the data.
Related documents
Probability and Statistics Vocabulary List (Definitions ...
online.math.uh.eduProb & Stat Vocab Probability and Statistics Vocabulary List (Definitions for Middle School Teachers) B • Bar graph – a diagram representing the frequency distribution for nominal or discrete data. It consists of a sequence of bars, or rectangles, corresponding to the possible values, and the
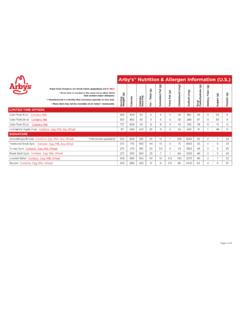
pjm†•uv Major food allergens are listed below underlined ...
cds.arbys.comMajor food allergens are listed below underlined and in RED. † * ® ^ ° ^ ° ^ ° ^ ° ^ ° ^ ° ^ ° ^ ° ^ ° ^ ° ^ ° ^ ° ^°
13 Determining the Sample Size - Department of Statistics
www.stat.columbia.eduA helpful tutorial on sample size issues is the paper by Steven Julious in Statistics in Medicine (Julious, 2004); a classic text is that of Desu and Raghavarao (1990). Nowadays, the use of specialist software for sample size determination such as NQuery, PASS or Power and Precision is common. We now consider the issues. 13.2 ISSUES

Logs In Regression - Statistics Department
www-stat.wharton.upenn.eduStatistics 621 Robert Stine Fall, 2001 5 as long as the changes are “small” relative to past values. Thus we have shown that on average, sales increase 3.4% per period. Logs as the Predictor and the Response In this case, the coefficient is known as an elasticity. Elasticities are described ...

Missing-data imputation - Department of Statistics
www.stat.columbia.edu530 MISSING-DATA IMPUTATION 25.1 Missing-data mechanisms To decide how to handle missing data, it is helpful to know why they are missing. We consider four general “missingness mechanisms,” moving from the simplest to

3 Basics of Bayesian Statistics
www.stat.cmu.eduBasics of Bayesian Statistics Suppose a woman believes she may be pregnant after a single sexual encounter, but she is unsure. So, she takes a pregnancy test that is known to be 90% accurate—meaning it gives positive results to positive cases 90% of the time— and the test produces a positive result. 1 Ultimately, she would like to know the
SPSS: Descriptive and Inferential Statistics
stat.utexas.edudescriptive statistics available, many of which are described in the preceding section. The example in the above dialog box would produce the following output: Going back to the Frequencies dialog box, you may click on the Statistics button to request additional descriptive statistics. Clicking on the Charts button produces the following box which

Multiple Regression - Statistics at UC Berkeley
www.stat.berkeley.eduably enough, we can still solve this problem. Even better, a statistics package can find the coefficients of the least squares model easily. Here’s a typical example of a multiple regression table: Dependent variable is: Pct BF R-squared 5 71.3% R-squared (adjusted) 5 71.1% s 5 4.460 with 250 2 3 5 247 degrees of freedom
1 Why is multiple testing a problem? - Statistics at UC ...
www.stat.berkeley.eduP(at least one signi cant result) = 1 P(no signi cant results) = 1 (1 0:0025)20 ˇ 0:0488 Here, we’re just a shade under our desired 0.05 level.

4. Introduction to Statistics Descriptive Statistics
cosmologist.infoStatistics for Engineers 4-2 The frequency of a value is the number of observations taking that value. A frequency table is a list of possible values and their frequencies. A bar chart consists of bars corresponding to each of the possible values, whose heights are equal to the frequencies. Example The numbers of accidents experienced by 80 machinists in a certain industry over a