
Bernoulli Distribution
– Frequency function of X p(x) = ‰ µx(1¡µ)1¡x for x 2 f0;1g 0 otherwise – Often: X = ‰ 1 if event A has occured 0 otherwise Example: A = blood pressure above 140/90 mm HG. Distributions, Jan 30, 2003 - 1 -
Download Bernoulli Distribution

Information
Domain:
Source:
Link to this page:
Documents from same domain

Prologue - University of Chicago
galton.uchicago.eduLECTURE 5: BROWNIAN MOTION 1. Prologue We have seen in previous lectures that, for discrete multiperiod markets which admit no …
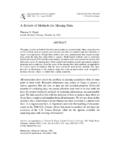
A Review of Methods for Missing Data - University …
galton.uchicago.eduEducational Research and Evaluation 1380-3611/01/0704-353$16.00 2001, Vol. 7, No. 4, pp. 353–383 # Swets & Zeitlinger A Review of Methods for Missing Data …

Department of Statistics, University of Chicago
galton.uchicago.eduDepartment of Statistics, Columbia University PER A. MYKLAND Department of Statistics, University of Chicago We propose a methodology for evaluating the hedging errors of derivative securities due to the discreteness of trading times or the observation times of market prices, or
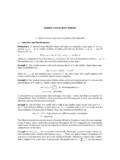
MARKOV CHAINS: BASIC THEORY - University of Chicago
galton.uchicago.eduMARKOV CHAINS: BASIC THEORY 3 Definition 2. A nonnegative matrix is a matrix with nonnegative entries. A stochastic matrix is a square nonnegative matrix all of whose row sums are 1. A substochastic matrix is a square nonnegative matrix all of whose row sums are 1.

CONVERGENCE RATES OF MARKOV CHAINS
galton.uchicago.eduMarkov chains for which the convergence rate is of particular interest: (1) the random-to-top shuffling model and (2) the Ehrenfest urn model. Along the way we will encounter a number of fundamental concepts and techniques, notably reversibility, total variation distance, and
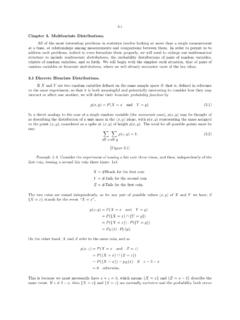
Chapter 3. Multivariate Distributions.
galton.uchicago.edu3-1 Chapter 3. Multivariate Distributions. ... structure to include multivariate distributions, the probability distributions of pairs of random variables, triplets of random variables, and so forth. We will begin with the simplest such situation, that of pairs of ... describes a surface in 3-dimensional space, and the probability that (X;Y) ...
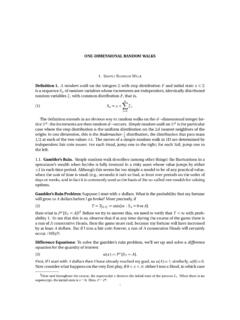
ONE-DIMENSIONAL RANDOM WALKS
galton.uchicago.edupost- y process is just an independent simple random walk started at y. But (10) (with the roles of x,y reversed) implies that this random walk must eventually visit x. When this happens, the random walk restarts again, so it will go back to y, and so on. Thus, by an easy induction argu-ment (see Corollary 14 below): Theorem 4.

CONDITIONAL EXPECTATION AND MARTINGALES
galton.uchicago.educonditional expectations behave like ordinary expectations, with random quantities that are functions of the conditioning random variable being treated as constants.2 Let Y be a random variable, vector, or object valued in a measurable space, and let X be an integrable random variable (that is, a random variable with EjXj˙1).
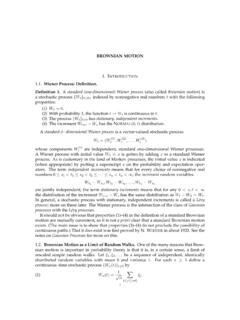
BROWNIAN MOTION - Department of Statistics
galton.uchicago.eduMany stochastic processes behave, at least for long stretches of time, like random walks with small but frequent jumps. The argument above suggests that such processes will look, at least approximately, and on the appropriate time scale, like Brownian motion. Second, it suggests that many important “statistics” of the random walk will have lim-

CONDITIONAL EXPECTATION AND MARTINGALES
galton.uchicago.eduadapted sequence of integrable real-valued random variables, that is, a sequence with the prop-erty that for each n the random variable Xn is measurable relative to Fn and such that EjXnj˙ 1. The sequence X0,X1,... is said to be a martingale relative to the filtration {Fn}n‚0 if it is adapted and if for every n, (1) E(Xn¯1 jFn) ˘ Xn.
Related documents

Chapter 2: Frequency Distributions and Graphs (or making ...
math.ucdenver.eduCh2: Frequency Distributions and Graphs Santorico -Page 30 For quantitative variables we have grouped and ungrouped frequency distributions. An Ungrouped Frequency Distribution is a frequency distribution where each class is only one unit wide. Meaningful when the data does not take on many values.
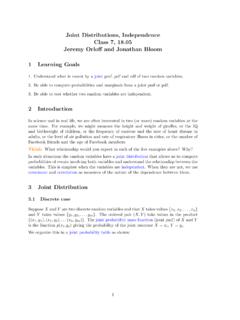
Reading 7a: Joint Distributions, Independence
ocw.mit.eduJoint Distributions, Independence Class 7, 18.05 Jeremy Orlo and Jonathan Bloom 1 Learning Goals 1. Understand what is meant by a joint pmf, pdf and cdf of two random variables. 2. Be able to compute probabilities and marginals from a joint pmf or pdf. 3. Be able to test whether two random variables are independent. 2 Introduction
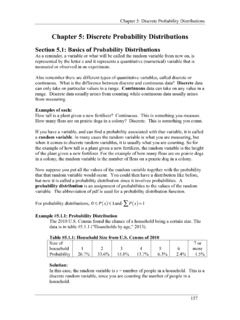
Chapter 5: Discrete Probability Distributions
coconino.eduChapter 5: Discrete Probability Distributions 158 This is a probability distribution since you have the x value and the probabilities that go with it, all of the probabilities are between zero and one, and the sum of all of the probabilities is one. You can give a probability distribution in table form (as in table #5.1.1) or as a graph.

RANDOM VARIABLES AND PROBABILITY DISTRIBUTIONS
www2.econ.iastate.edu4 RANDOM VARIABLES AND PROBABILITY DISTRIBUTIONS FX(x)= 0 forx <0 1 16 for0 ≤ x<1 5 16 for1 ≤ x<2 11 16 for2 ≤ x<3 15 16 for3 ≤ x<4 1 forx≥ 4 1.6.4. Second example of a cumulative distribution function. Consider a group of N individuals, M of
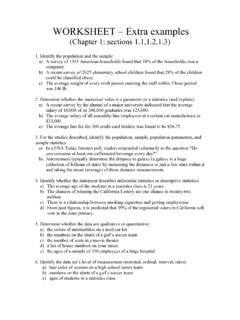
WORKSHEET – Extra examples
www.math.utah.edu2.1 Frequency Distributions and Their Graphs Example 1: The following data set lists the midterm scores received by 50 students in a chemistry class: 45 85 92 99 37 68 67 78 81 25 97 100 82 49 54 78 89 71 94 87 21 77 81 83 98 97 74 81 39 77
Chapter 2: Frequency Distributions - FTMS
ftms.edu.myFrequency Distributions •After collecting data, the first task for a researcher is to organize and simplify the data so that it is possible to get a general overview of the results. •This is the goal of descriptive statistical techniques. •One method for simplifying and organizing data is to construct a frequency distribution.

2.4.8 Kullback-Leibler Divergence
hanj.cs.illinois.edufrom an observed frequency distribution, as illustrate in the following example. Example 2.24. Computing the KL Divergence by Smoothing. Sup-pose there are two sample distributions P and Q as follows: P: (a: 3/5,b:
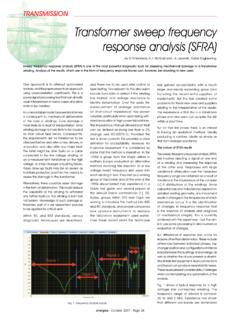
Transformer sweep frequency response analysis (SFRA)
www.ee.co.zafrequency range are obtained as a result of variations in the impedance of the complex L-C-R distributions of the windings. Since capacitances and inductances depend on detailed winding geometry, any movement results in changes in the frequencies at which resonances occur. It is the identification of changes in frequency response that

Random Variables, Distributions, and Expected Value
www0.gsb.columbia.eduRandom Variables, Distributions, and Expected Value Fall2001 ProfessorPaulGlasserman B6014: ManagerialStatistics 403UrisHall The Idea of a Random Variable