Bode Plot: Example 1 - utoledo.edu
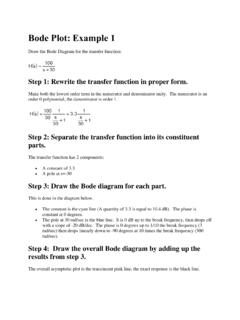
linearly down to -180 degrees at 10 times the break frequency. The magnitude and phase drop twice as steeply as those for a single pole. The zero at the origin is the red line. It has a slope of +20 dB/dec and goes through 0 dB at 1 rad/sec. The phase is 90 degrees. Step 4: Draw the overall Bode diagram by adding up the results from step 3.
Download Bode Plot: Example 1 - utoledo.edu

Information
Domain:
Source:
Link to this page:
Documents from same domain

Intrinsic safety 101 - UToledo Engineering
www.eng.utoledo.eduIntrinsic safety 101 Protection methods, containment, segregation, and prevention ... AUTOMATION BASICS a low-voltage signaling system that was used to ... physical principles of explosion protection are the same worldwide and are not differentiated,
Chapter 19 Programming the PID Algorithm
www.eng.utoledo.eduthe power F B that the pressure P 2 ... a controller setting has to be found that supplies a sufficiently fast and stable control result over the entire working range. ... Module Configuration, 4 Channel Module Wiring, and 4 Channel Module Specifications to find the choices available for Analog Inputs and Analog Outputs.
![CHAP. 7] BLOCK DIAGRAM ALGEBRA AND TRANSFER …](/cache/preview/5/5/8/8/1/3/4/c/thumb-5588134cce7b9b85f7cd5a0611a184e9.jpg)
CHAP. 7] BLOCK DIAGRAM ALGEBRA AND TRANSFER …
www.eng.utoledo.eduBLOCK DIAGRAM ALGEBRA AND TRANSFER FUNCTIONS OF SYSTEMS 161---t o2÷o0 Step 3:-t -R GIG4 '1 -- GIG4H1 Step 4: Does not apply. Step 5: I -- GIG4111 , Gs q- G3 1 -- GIG4HI Step 6: Does not apply. € An occasional requirement of block diagram reduction is the isolation of a particular block in a feedback or feedforward loop.
Chapter 7 TIMERS, COUNTERS and T/C APPLICATIONS
www.eng.utoledo.eduspecify whether the IEC timer is stored in its own data block (single instance) or as a local tag (multiple instance) in the block interface. ... P T P T Th e s e fig u re s s h o w p u ls e d ia g ra m s o f th e G e n e ra te O ff-De la y in s tru c tio n : Fig. 7-8 Off-Delay Timer Timing Diagrams . Ch 7 Timers, Counters, T/C Applications 8 ...

Chapter 15 HUMAN MACHINE INTERFACE - utoledo.edu
www.eng.utoledo.eduThe A-B product uses RSLinx Enterprise. This means that RSLinx Enterprise has the ability to allow this software package to browse directly for the tag database and link existing tags and not requiring a tag created in the HMI to complement the tag in the PLC. When starting a new application, select Objects from the main menu. Notice the types ...
CHAP. 7] BLOCK DIAGRAM ALGEBRA AND TRANSFER …
www.eng.utoledo.eduAlso, the transfer function of a single block is its output-to-input transform'. Hence (b) (c) This system has the same transfer function determined in part (a) because multiplication of transfer functions is commutative. By Equation (7..1), we have _,0 ,4 7.4. The transfer function of Fig. 7-14a is %/(s + too), whe.re too = 1/RC. Is the ...
Chapter 15 HUMAN MACHINE INTERFACE - eng.utoledo.edu
www.eng.utoledo.eduCh 15 Human Machine Interface 4 Fig. 15-7 A handheld thermocouple readout device with paper recording output Fig. 15-8 Several discrete controller devices for process control. Each device is capable of solving a single or multiple loops of process data executing a PID formula and controlling the output of the control loop.

Studio 5000 View Designer User Manual
www.eng.utoledo.eduWhat is the Alarm Manager? on page 105 In Alarm Manager updated the wording in the tip. Work with screenson page . 107 Updated maximum numbers of screens and popups for PanelView devices. Screen tab on . page 107 Create a screen on . page 108 Change the background color of a popup on . page 110 Updated steps in the task. Rename a screen
Chapter 19 Programming the PID Algorithm - utoledo.edu
www.eng.utoledo.educontrollers. However, as PLC prices continued to fall during the 1980’s and later and more ... SLC PID block followed by the CompactLogix processor as well as the Siemens 1200 and their ... Module Configuration, 4 Channel Module Wiring, and 4 Channel Module Specifications to find the choices available for Analog Inputs and Analog Outputs.
Bode Plot: Example 1 - utoledo.edu
www.eng.utoledo.eduStep 1: Rewrite the transfer function in proper form. Make both the lowest order term in the numerator and denominator unity. The numerator is an order 1 polynomial, the denominator is order 2. Step 2: Separate the transfer function into its constituent parts. The transfer function has 4 components: A constant of 0.1 A pole at s=-10
Related documents
Chapter 5 Capacitance and Dielectrics
web.mit.edulinearly with the area A since for a given potential difference ∆V, a bigger plate can hold more charge. On the other hand, C is inversely proportional to d, the distance of separation because the smaller the value of d, the smaller the potential difference |∆V | for a fixed Q. Interactive Simulation 5.1: Parallel-Plate Capacitor

The Standard Atmosphere - Virginia Tech
www.dept.aoe.vt.edu•In t he gradient regions, T depends linearly on h (T-T 1)/(h-h 1) = dT/dh = a (a = lapse rate) •So, dh = dT/a ⇒ dp/p = - g 0 dT/(aRT) • Integrating [Exercise] leads to p/p 1 = (T/T 1)-g0/(aR) ρ/ρ 1 = (T/T 1)-[g0/(aR)+1] • Since T=T(h), we can write p=p(h) and ρ=ρ(h) • And it all starts at sea level, where h=h G=0 •Bn wh:igtei ...

18.03SCF11 text: Delta Functions: Unit Impulse
ocw.mit.eduThus, the graphs for Q(t) rise linearly to 1 and then stay equal to 1 thereafter. In other words, the total amount dumped in each case is 1. Now let q h(t) be a box of width h and height 1/h. As h →0, the width of the box becomes 0, the graph looks more and more like a spike, yet it still has area 1 (see Figure 2). t 1 1

Euler-Bernoulli Beams: Bending, Buckling, and Vibration
ocw.mit.eduEuler-Bernoulli Beams: Bending, Buckling, and Vibration David M. Parks 2.002 Mechanics and Materials II Department of Mechanical Engineering MIT February 9, 2004

The Rank of a Matrix - Texas A&M University
www.math.tamu.eduk} is linearly independent (LI) if the equation Xk j=1 c ju j = 0, where the c j’s are scalars, has only c 1 = c 2 = ··· = c k = 0 as a solution. Otherwise, the vectors are linearly dependent (LD). Let’s assume the vectors are all m × 1 column vectors. If they are rows, just transpose them. Now, use the basic matrix

Title stata.com ipolate — Linearly interpolate ...
www.stata.comipolate— Linearly interpolate (extrapolate) values 3 Example 2 We have a dataset of circulations for 10 magazines from 1980 through 2003. The identity of the magazines is recorded in magazine, circulation is recorded in circ, and the year is recorded in year.