Example: air traffic controller
Title stata.com ipolate — Linearly interpolate ...
ipolate— Linearly interpolate (extrapolate) values 3 Example 2 We have a dataset of circulations for 10 magazines from 1980 through 2003. The identity of the magazines is recorded in magazine, circulation is recorded in circ, and the year is recorded in year.
Tags:
Information
Domain:
Source:
Link to this page:
Documents from same domain

Syntax - Stata
www.stata.com2cluster kmeans and kmedians— Kmeans and kmedians cluster analysis Options Main k(#) is required and indicates that # groups are to be formed by the cluster analysis.

Syntax Description - Stata
www.stata.com2substr()— Extract substring Diagnostics In substr(s, b, l) and substr(s, b), if b describes a position before the beginning of the string or after the end, "" is returned.

Title stata.com generate — Create or change …
www.stata.comTitle stata.com generate — Create or change contents of variable SyntaxMenuDescriptionOptions Remarks and examplesMethods and formulasReferencesAlso see Syntax Create new variable generate type newvar

SyntaxDescriptionRemarks and examplesAlso see
www.stata.commacro— Macro definition and manipulation 3 Macro extended functions related to matrices rownamesjcolnamesjrowfullnamesjcolfullnames matname roweqjcoleq

Title stata.com graph box — Box plots
www.stata.comgraph box— Box plots 3 Menu Graphics > Box plot Syntax graph box yvars if in weight, options graph hbox yvars if in weight, options where yvars is a varlist options Description

Title stata
www.stata.comarea options — Options for specifying the look of special areas 3 Also see [G-2] graph dot — Dot charts (summary statistics)

www.stata.com
www.stata.com2cluster dendrogram— Dendrograms for hierarchical cluster analysis The height of the vertical lines and the range of the (dis)similarity axis give visual clues about the

Title stata.com putexcel — Export results to an Excel …
www.stata.computexcel— Export results to an Excel file 3 export options Description Main overwritefmt overwrite existing cell formatting when exporting new content

destring — Convert string variables to numeric ... - …
www.stata.comTitle stata.com destring — Convert string variables to numeric variables and vice versa SyntaxMenuDescription Options for destringOptions for tostringRemarks and …

Title stata.com gettoken — Low-level parsing
www.stata.comTitle stata.com gettoken — Low-level parsing SyntaxDescriptionOptionsRemarks and examplesAlso see Syntax gettoken emname1 emname2: emname3, parse("pchars") quotes qed(lmacname) match(lmacname) bind
Related documents

The Rank of a Matrix - Texas A&M University
www.math.tamu.eduk} is linearly independent (LI) if the equation Xk j=1 c ju j = 0, where the c j’s are scalars, has only c 1 = c 2 = ··· = c k = 0 as a solution. Otherwise, the vectors are linearly dependent (LD). Let’s assume the vectors are all m × 1 column vectors. If they are rows, just transpose them. Now, use the basic matrix
Chapter 5 Capacitance and Dielectrics
web.mit.edulinearly with the area A since for a given potential difference ∆V, a bigger plate can hold more charge. On the other hand, C is inversely proportional to d, the distance of separation because the smaller the value of d, the smaller the potential difference |∆V | for a fixed Q. Interactive Simulation 5.1: Parallel-Plate Capacitor
The Standard Atmosphere - Virginia Tech
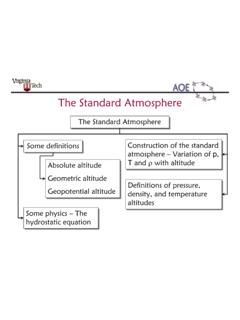
www.dept.aoe.vt.edu•In t he gradient regions, T depends linearly on h (T-T 1)/(h-h 1) = dT/dh = a (a = lapse rate) •So, dh = dT/a ⇒ dp/p = - g 0 dT/(aRT) • Integrating [Exercise] leads to p/p 1 = (T/T 1)-g0/(aR) ρ/ρ 1 = (T/T 1)-[g0/(aR)+1] • Since T=T(h), we can write p=p(h) and ρ=ρ(h) • And it all starts at sea level, where h=h G=0 •Bn wh:igtei ...
Bode Plot: Example 1 - utoledo.edu
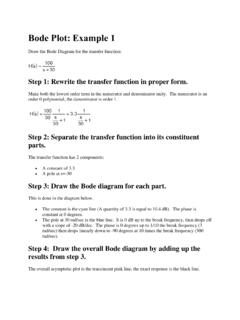
www.eng.utoledo.edulinearly down to -180 degrees at 10 times the break frequency. The magnitude and phase drop twice as steeply as those for a single pole. The zero at the origin is the red line. It has a slope of +20 dB/dec and goes through 0 dB at 1 rad/sec. The phase is 90 degrees. Step 4: Draw the overall Bode diagram by adding up the results from step 3.

18.03SCF11 text: Delta Functions: Unit Impulse
ocw.mit.eduThus, the graphs for Q(t) rise linearly to 1 and then stay equal to 1 thereafter. In other words, the total amount dumped in each case is 1. Now let q h(t) be a box of width h and height 1/h. As h →0, the width of the box becomes 0, the graph looks more and more like a spike, yet it still has area 1 (see Figure 2). t 1 1

Euler-Bernoulli Beams: Bending, Buckling, and Vibration
ocw.mit.eduEuler-Bernoulli Beams: Bending, Buckling, and Vibration David M. Parks 2.002 Mechanics and Materials II Department of Mechanical Engineering MIT February 9, 2004