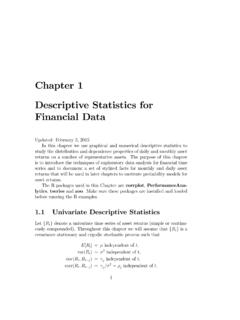
Chapter 1 Descriptive Statistics for Financial Data
Feb 03, 2015 · 1.1.1 Example Data We illustrate the descriptive statistical analysis using daily and monthly ad-justed closing prices on Microsoft stock and the S&P 500 index over the period January 1, 1998 and May 31, 2012. 1 These data are obtained from finance.yahoo.com.Wefirst use the daily and monthly data to illustrate
Download Chapter 1 Descriptive Statistics for Financial Data

Information
Domain:
Source:
Link to this page:
Documents from same domain
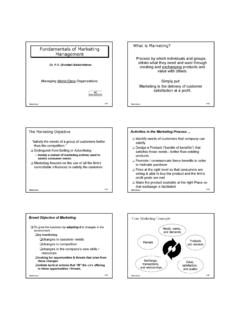
What is Marketing? Fundamentals of Marketing …
faculty.washington.eduBalakrishnan S #1 Fundamentals of Marketing Management Managing World-Class Organizations Dr. P.V. (Sundar) Balakrishnan Balakrishnan S #2 What is Marketing?
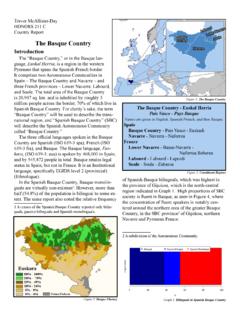
The Basque Country - University of Washington
faculty.washington.eduTrevor McAllister-Day HONORS 211 C Country Report The Basque Country Introduction The “Basque Country,” or in the Basque lan-guage, Euskal Herria, is a …
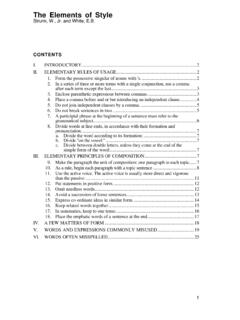
The Elements of Style
faculty.washington.eduThe Elements of Style Strunk, W., Jr. and White, E.B. CONTENTS ... The writer's colleagues in the Department of English in Cornell University have greatly helped him in the preparation of his manuscript. Mr. George McLane Wood has kindly consented to the inclusion under Rule 11 of some material from his
Blogging With Photovoice: Sharing Pictures in an ...
faculty.washington.eduLetter to Parents and the Photovoice Project Instructions explaining the assignment and making sure that all students have permission to use the blog you have created. This letter can also help you make certain that all students have access to a camera (see Step 5).
BEAGLE 3.3 - University of Washington
faculty.washington.eduBeagle is used to phase genotype data for unrelated individuals, the input Beagle file contains unphased unrelated data, and the output Beagle file contains phased unrelated data. Input files with phased unrelated data are specified with the phased command line argument (see Section 3.2.1).
Brian L. Browning Department of Medicine Division of ...
faculty.washington.eduBeagle assumes that any input VCF file that has a name ending in “.gz” is compressed with gzip or bgzip, and that any reference file that has a name ending in “bref”VCF is compressed with the program. bref Output VCF, IBD, and HBD files are with compressed

Brainy Word Search Puzzles - University of Washington
faculty.washington.eduParts of the Brain Parts of the Nervous System Lobes of the Brain Cerebral Cortex
From Sage on the Stage to Guide on the Side
faculty.washington.eduFrom Sage on the Stage to Guide on the Side Alison King In most college classrooms, the pro fessor lectures and the students listen and take notes.
An Overview of Economics - University of Washington
faculty.washington.edu2 Preview Economics is one of the oldest and most influential of intellectual disciplines. Practically all of the great thinkers, from Aristotle to Einstein,
Seismology and Earthquake Engineering
faculty.washington.eduand Space Sciences who wish to obtain an introduction to seismology and earthquake engineering. The course covers a wide range of topics. For each topic, the goal of the course is to develop a general understanding of the important issues and a specific
Related documents

4. Introduction to Statistics Descriptive Statistics
cosmologist.infoStatistics for Engineers 4-1 4. Introduction to Statistics Descriptive Statistics Types of data A variate or random variable is a quantity or attribute whose value may vary from one unit of investigation to another. For example, the units might be headache sufferers and

Descriptive Statistics – Summary Tables
ncss-wpengine.netdna-ssl.com2 Specify the Descriptive Statistics – Summary Tables procedure options • Find and open the Descriptive Statistics – Summary Tables procedure using the menus or the Procedure Navigator. • The settings for this example are listed below and are stored in the Example 1a settings template. To load

Descriptive and Inferential Statistics - PSY 225: Research ...
online225.psych.wisc.eduDescriptive Statistics Descriptive statistics is the term given to the analysis of data that helps describe, show or summarize data in a meaningful way such that, for example, patterns might emerge from the data. Descriptive statistics do not, however, allow us to make conclusions beyond the data we have analysed or
SPSS: Descriptive and Inferential Statistics
stat.utexas.eduSection 1: Summarizing Data 1.1 Descriptive Statistics A common first step in data analysis is to summarize information about variables in your dataset, such as the averages and variances of variables. Several summary or descriptive statistics are available under the Descriptives option available from the Analyze and Descriptive Statistics menus:

Experimental Design Statistical Analysis of Data
uca.eduExperimental Design: Statistical Analysis of Data Purpose of Statistical Analysis Descriptive Statistics Central Tendency and Variability Measures of Central Tendency Mean Median Mode Measures of Variability Range Variance and standard deviation The Importance of Variability Tables and Graphs Thinking Critically About Everyday Information ...

Types of Data, Descriptive Statistics, and Statistical ...
www.accp.comTypes of Data, Descriptive Statistics, and Statistical Tests for Nominal Data Patrick F. Smith, Pharm.D. University at Buffalo Buffalo, New York ~.. \ 1 NONPARAMETRIC STATISTICS I. DEFINITIONS A. Parametric statistics 1. Variable of interest is a measured quantity. 2. Assumes that the data follow some distribution which can be described by ...
Lecture 2: Descriptive Statistics and Exploratory Data ...
www.gs.washington.edu•Calculating descriptive statistics in R •Creating graphs for different types of data (histograms, boxplots, scatterplots) •Useful R commands for working with multivariate data (apply and its derivatives) •Basic clustering and PCA analysis
Exploring Data and Descriptive Statistics (using R)
www.princeton.edu# ‘to.data.frame’ return a data frame. # ‘use.value.labels’ Convert variables with value labels into R factors with those levels. # ‘use.missings’ logical: should information on user-defined missing values be used to set the