Transcription of Descriptive Statistics – Summary Tables
1 NCSS Statistical Software 201-1 NCSS, LLC. All Rights Reserved. Chapter 201 Descriptive Statistics Summary Tables Introduction This procedure is used to summarize continuous data. Large volumes of such data may be easily summarized in statistical Tables of means, counts, standard deviations, etc. Categorical group variables may be used to calculate summaries for individual groups. The Tables are similar in structure to those produced by cross tabulation. This procedure produces Tables of the following Summary Statistics : Count Missing Count Sum Mean Standard Deviation (Std Dev) Standard Error (Std Error) Lower 95% Confidence Limit for the Mean (95% LCL) Upper 95% Confidence Limit for the Mean (95% UCL) Median Minimum Maximum Range Interquartile Range (IQR) 10th Percentile (10th Pctile) 25th Percentile (25th Pctile) 75th Percentile (75th Pctile) 90th Percentile (90th Pctile) Variance Mean Absolute Deviation (MAD) Mean Absolute Deviation from the Median (MADM) Coefficient of Variation (COV) Coefficient of Dispersion (COD) Skewness Kurtosis Types of Categorical Variables Note that we will refer to two types of categorical variables: Group Variables and Break Variables.
2 The values of a Group Variable are used to define the rows, sub rows, and columns of the Summary table. Up to two Group Variables may be used per table. Group Variables are not required. Break Variables are used to split a database into subgroups. A separate report is generated for each unique set of values of the break variables. NCSS Statistical Software Descriptive Statistics Summary Tables 201-2 NCSS, LLC. All Rights Reserved. Data Structure The data below are a subset of the Resale dataset provided with the software. This (computer simulated) data gives the selling price, the number of bedrooms, the total square footage (finished and unfinished), and the size of the lots for 150 residential properties sold during the last four months in two states. This data is representative of the type of data that may be analyzed with this procedure. Only the first 8 of the 150 observations are displayed.
3 Resale dataset (subset) State Price Bedrooms TotalSqft LotSize Nev 260000 2 2042 10173 Nev 66900 3 1392 13069 Vir 127900 2 1792 7065 Nev 181900 3 2645 8484 Nev 262100 2 2613 8355 Nev 147500 2 1935 7056 Nev 167200 2 1278 6116 Nev 395700 2 1455 14422 Missing Values Observations with missing values in either the group variables or the continuous data variables are ignored. The procedure also allows you to specify up to 5 additional values to be considered as missing in categorical group variables. Summary Statistics The following sections outline the Summary Statistics that are available in this procedure. Count The number of non-missing data values, n. If no frequency variable was specified, this is the number of rows with non-missing values. Missing Count The number of missing data values. If no frequency variable was specified, this is the number of rows with missing values. Sum The sum (or total) of the data values.
4 =niixSum1 = NCSS Statistical Software Descriptive Statistics Summary Tables 201-3 NCSS, LLC. All Rights Reserved. Mean The average of the data values. nxxnii =1 = Variance The sample variance, s2, is a popular measure of dispersion. It is an average of the squared deviations from the mean. sxxniin2121 = ()= Standard Deviation (Std Dev) The sample standard deviation, s, is a popular measure of dispersion. It measures the average distance between a single observation and the mean. It is equal to the square root of the sample variance. sxxniin = ()= 121 Standard Error (Std Error) The standard error of the mean, a measure of the variation of the sample mean about the population mean, is computed by dividing the sample standard deviation by the square root of the sample size. ssnx= 95% Confidence Interval for the Mean (95% LCL & 95% UCL) This is the upper and lower values of a 95% confidence interval estimate for the mean based on a t distribution with n 1 degrees of freedom.
5 This interval estimate assumes that the population standard deviation is not known and that the data for this variable are normally distributed. xnastx1,2/ CI 95% = Minimum The smallest data value. Maximum The largest data value. NCSS Statistical Software Descriptive Statistics Summary Tables 201-4 NCSS, LLC. All Rights Reserved. Range The difference between the largest and smallest data values. Range = Maximum Minimum Percentiles The 100pth percentile is the value below which 100p% of data values may be found (and above which 100p% of data values may be found).The 100pth percentile is computed as Z100p = (1-g)X[k1] + gX[k2] where k1 equals the integer part of p(n+1), k2=k1+1, g is the fractional part of p(n+1), and X[k] is the kth observation when the data are sorted from lowest to highest. Median The median (or 50th percentile) is the middle number of the sorted data values.
6 Median = Z50 Interquartile Range (IQR) The difference between the 75th and 25th percentiles (the 3rd and 1st quartiles). This represents the range of the middle 50% of the data. It serves as a robust measure of the variation in the data. IQR = Z75 Z25 Mean Absolute Deviation (MAD) A measure of dispersion that is not affected by outliers as much as the standard deviation and variance. It measures the average absolute distance between a single observation and the mean. MADxxniin = ||= 1 Mean Absolute Deviation from the Median (MADM) A measure of dispersion that is even more robust to outliers than the mean absolute deviation (MAD) since the median is used as the center point of the distribution. It measures the average absolute distance between a single observation and the median. nMedianxMADMnii|| =1 = NCSS Statistical Software Descriptive Statistics Summary Tables 201-5 NCSS, LLC.
7 All Rights Reserved. Coefficient of Variation (COV) A relative measure of dispersion used to compare the amount of variation in two samples. It is calculated by dividing the standard deviation by the mean. Sometimes it is referred to as COV or CV. xs = COV Coefficient of Dispersion (COD) A robust, relative measure of dispersion. It is calculated by dividing the robust mean absolute deviation from the median (MADM) by the median. It is frequently used in real estate or tax assessment applications. MediannMedianxMedianMADMCODnii = =|| =1 Skewness Measures the direction and degree of asymmetry in the data distribution. 2/323 =mmSkewness where mxxnriinr = ()= 1 Kurtosis Measures the heaviness of the tails in the data distribution. 224 =mmKurtosis where mxxnriinr = ()= 1 NCSS Statistical Software Descriptive Statistics Summary Tables 201-6 NCSS, LLC. All Rights Reserved.
8 Example 1 Basic Variable Summary Report (No Group Variables) The data used in this example are in the Resale dataset. Setup To run this example, complete the following steps: 1 Open the Resale example dataset From the File menu of the NCSS Data window, select Open Example Data. Select Resale and click OK. 2 Specify the Descriptive Statistics Summary Tables procedure options Find and open the Descriptive Statistics Summary Tables procedure using the menus or the Procedure Navigator. The settings for this example are listed below and are stored in the Example 1a settings template. To load this template, click Open Example Template in the Help Center or File menu. Option Value Variables Tab Data Variable(s) .. Price, Bedrooms, Bathrooms, Garage, TotalSqft Statistics .. Count, Mean, Std Dev, 95% LCL, 95% UCL Report Options (in the Toolbar) Variable Labels .. Column Names 3 Run the procedure Click the Run button to perform the calculations and generate the output.
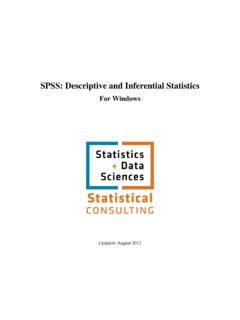
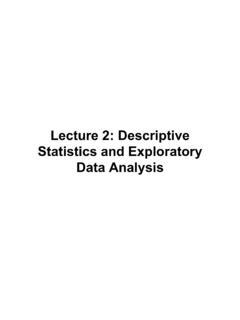
9 Summary Table Summary Table Variable Statistic Price Bedrooms Bathrooms Garage TotalSqft Count 150 150 150 150 150 Mean 174392 Standard Deviation Lower 95% CL Mean 158636 Upper 95% CL Mean 190148 The table is created with the Statistics as rows and the data variables as columns when the positions are both set to Auto . NCSS Statistical Software Descriptive Statistics Summary Tables 201-7 NCSS, LLC. All Rights Reserved. Plots of Each Statistic Plots of each Statistic (More Plots Follow) The plots are not very informative because the variables have vastly different scales. Example 1b Adjust Item Table Positions (Data Variables in Rows and Statistics in Columns) To rotate the table, all we have to do is change the position of one of the items.
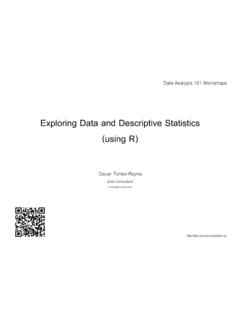
10 To do this, change Data Variable(s) Position to Rows and run the procedure again to get the results. 4 Modify the Data Variable(s) Position The settings for this section are listed below and are stored in the Example 1b settings template. To load this template, click Open Example Template in the Help Center or File menu. Option Value Variables Tab Data Variable(s) Position .. Rows 5 Run the procedure Click the Run button to perform the calculations and generate the output. NCSS Statistical Software Descriptive Statistics Summary Tables 201-8 NCSS, LLC. All Rights Reserved. Summary Table Statistic Variable Standard Lower 95% Upper 95% Count Mean Deviation CL Mean CL Mean Price 150 174392 158636 190148 Bedrooms 150 Bathrooms 150 Garage 150 TotalSqft 150 The table is now rotated with the data variables as rows and the Statistics as columns.