Chapter 205 One-Sample T-Test
Kurtosis, coefficient of variation, coefficient of dispersion, percentiles, additional normality tests, and a stem-and-leaf plot. Research Questions For the one-sample situation, the typical concern in research is examining a measure of central tendency (location) for the population of interest.
Download Chapter 205 One-Sample T-Test

Information
Domain:
Source:
Link to this page:
Documents from same domain

Mixed Models - Repeated Measures - Statistical …
ncss-wpengine.netdna-ssl.comMixed Models – Repeated Measures Introduction ... analysis, and the amount of data available for the analysis. When more than one fixed factor may influence the

Repeated Measures Analysis - NCSS
ncss-wpengine.netdna-ssl.comThis section provides the technical details of the repeated measures designs that can be analyzed by PASS. Earlier ... Repeated Measures Analysis ...

Chapter 469 Decomposition Forecasting - NCSS
ncss-wpengine.netdna-ssl.comChapter 469 Decomposition Forecasting Introduction Classical time series decomposition separates a time series into five components: mean, long-range trend, seasonality, cycle, and randomness. The decomposition model is Value = (Mean) x (Trend) x (Seasonality) x (Cycle) x (Random).

Chapter 575 Probit Analysis - Statistical Software
ncss-wpengine.netdna-ssl.comChapter 575 Probit Analysis Introduction Probit Analysis is a method of analyzing the relationship between a stimulus (dose) and the quantal (all or nothing) response. Quantitative responses are almost always preferred, but in many situations they are not practical. In these cases, it is only possible to determine if a certain response (such as ...

Chapter 720 Probit Analysis - Statistical Software
ncss-wpengine.netdna-ssl.comChapter 720 Probit Analysis. Introduction . Probit and logit analysis may be used for comparative LD. 50. studies for testing the efficacy of drugs designed to prevent lethality. This program module presents calculates power and sample size using the methodology outlined

Chapter 311 Stepwise Regression - Statistical Software
ncss-wpengine.netdna-ssl.comNCSS Statistical Software NCSS.com © NCSS, LLC. All Rights Reserved.

Chapter 208 Paired T-Test - NCSS
ncss-wpengine.netdna-ssl.comNCSS Statistical Software NCSS.com Paired T-Test 208-6 © NCSS, LLC. All Rights Reserved. Tests Alpha Alpha is the significance leve l used in the hypothesis tests.

Multivariate Analysis of Variance (MANOVA)
ncss-wpengine.netdna-ssl.comNCSS Statistical Software NCSS.com Multivariate Analysis of Variance (MANOVA) 415-4 © NCSS, LLC. All Rights Reserved. Assumptions and Limitations

Chapter 194 Normality Tests - NCSS
ncss-wpengine.netdna-ssl.comNCSS Statistical Software NCSS.com © NCSS, LLC. All Rights Reserved.

Distribution Weibull Fitting - NCSS
ncss-wpengine.netdna-ssl.comDistribution (Weibull) Fitting Introduction This procedure estimates the parameters of the exponential, extreme value, logistic, log-logistic, lognormal, normal, and Weibull probability distributions by maximum likelihood. It can fit complete, right censored, left censored, interval censored (readou t), and grouped data values.
Related documents
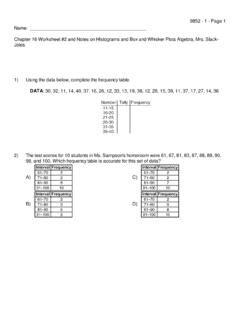
Worksheet #2 on Histograms and Box and Whisker Plots
www.enetlearning.org10) Construct a box-and-whisker graph using the following data: 16, 12, 13, 14, 16, 18, 15, 17, 20, 12, 14, 15, 15 Questions 11 through 14 refer to the following:
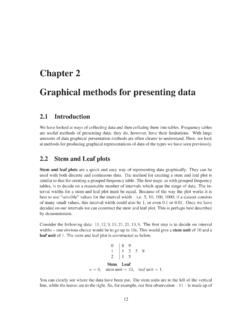
Chapter 2 Graphical methods for presenting data
www.mas.ncl.ac.ukStem Leaf n=10, stem unit =10, leaf unit =1. Here, the interval width is too large, resulting in only two intervals for our data. With such few intervals it is difficult to identify any patterns in the data. We can get a better idea about what is going on if we choose a smaller interval width – say 5. Doing so gives the following stem and ...
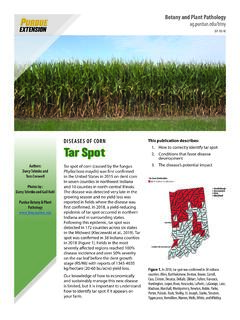
DISEASES OF CORN Tar Spot - Purdue University
www.extension.purdue.eduof leaf wetness (greater than 7 hours) promote infection and disease development. Wind-driven rain ... stem, and husk of the affected corn plant. ... Both hybrids infected with tar spot were in adjacent plots. The hybrid on the left had increased tar spot severity (>40%) leading to rapid ...
6th Grade Unpacked Math TEKS
www.gpisd.orgsame data including line plot, line graph, bar graph, stem and leaf plot, circle graph, and Venn diagram, and justify the selection *8.12 C Same as 7.11 A box and whisker plots, histograms, and Venn diagrams with and without the use of technology
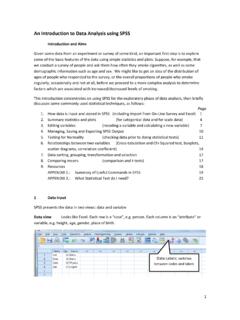
An Introduction to Data Analysis using SPSS
www.lboro.ac.uk‘Plots’ button and deselect ‘Stem-and-leaf ’and select ‘Histogram’, then click Continue and then OK. The table headed Descriptives in the Output window shows a huge number of summary statistics, some of which might be incorporated into a report as part of a brief summary of this data. Next are a

Data Analysis Declare data with Stata Cheat Sheet TIME ...
www.stata.comstem mpg return stem-and-leaf display of mpg summarize price mpg, detail calculate a variety of univariate summary statistics frequently used commands are highlighted in yellow univar price mpg, boxplot calculate univariate summary with box-and-whiskers plot ssc install univar returns e-class information when post option is used