Chapter 206 Two-Sample T-Test
Two-Sample T-Test Introduction This procedure provides several reports for the comparison of two continuous-data distributions, including confidence intervals for the difference in means, two-sample t-tests, the z-test, the randomization test, the Mann-Whitney U (or Wilcoxon Rank- Sum) nonparametric test, and the Kolmogorov-Smirnov test.
Download Chapter 206 Two-Sample T-Test

Information
Domain:
Source:
Link to this page:
Documents from same domain

Mixed Models - Repeated Measures - Statistical …
ncss-wpengine.netdna-ssl.comMixed Models – Repeated Measures Introduction ... analysis, and the amount of data available for the analysis. When more than one fixed factor may influence the

Repeated Measures Analysis - NCSS
ncss-wpengine.netdna-ssl.comThis section provides the technical details of the repeated measures designs that can be analyzed by PASS. Earlier ... Repeated Measures Analysis ...

Chapter 469 Decomposition Forecasting - NCSS
ncss-wpengine.netdna-ssl.comChapter 469 Decomposition Forecasting Introduction Classical time series decomposition separates a time series into five components: mean, long-range trend, seasonality, cycle, and randomness. The decomposition model is Value = (Mean) x (Trend) x (Seasonality) x (Cycle) x (Random).

Chapter 575 Probit Analysis - Statistical Software
ncss-wpengine.netdna-ssl.comChapter 575 Probit Analysis Introduction Probit Analysis is a method of analyzing the relationship between a stimulus (dose) and the quantal (all or nothing) response. Quantitative responses are almost always preferred, but in many situations they are not practical. In these cases, it is only possible to determine if a certain response (such as ...

Chapter 720 Probit Analysis - Statistical Software
ncss-wpengine.netdna-ssl.comChapter 720 Probit Analysis. Introduction . Probit and logit analysis may be used for comparative LD. 50. studies for testing the efficacy of drugs designed to prevent lethality. This program module presents calculates power and sample size using the methodology outlined

Chapter 311 Stepwise Regression - Statistical Software
ncss-wpengine.netdna-ssl.comNCSS Statistical Software NCSS.com © NCSS, LLC. All Rights Reserved.

Chapter 208 Paired T-Test - NCSS
ncss-wpengine.netdna-ssl.comNCSS Statistical Software NCSS.com Paired T-Test 208-6 © NCSS, LLC. All Rights Reserved. Tests Alpha Alpha is the significance leve l used in the hypothesis tests.

Multivariate Analysis of Variance (MANOVA)
ncss-wpengine.netdna-ssl.comNCSS Statistical Software NCSS.com Multivariate Analysis of Variance (MANOVA) 415-4 © NCSS, LLC. All Rights Reserved. Assumptions and Limitations

Chapter 194 Normality Tests - NCSS
ncss-wpengine.netdna-ssl.comNCSS Statistical Software NCSS.com © NCSS, LLC. All Rights Reserved.

Distribution Weibull Fitting - NCSS
ncss-wpengine.netdna-ssl.comDistribution (Weibull) Fitting Introduction This procedure estimates the parameters of the exponential, extreme value, logistic, log-logistic, lognormal, normal, and Weibull probability distributions by maximum likelihood. It can fit complete, right censored, left censored, interval censored (readou t), and grouped data values.
Related documents

Two-Sample T-Test from Means and SD’s - NCSS
ncss-wpengine.netdna-ssl.comTwo-Sample T-Test from Means and SD’s Introduction This procedure computes the two -sample t-test and several other two -sample tests directly from the mean, standard deviation, and sample size. Confidence intervals for the means, mean difference, and standard deviations can also be computed.

Tutorial 3: Power and Sample Size for the Two-sample t ...
samplesizeshop.orgFor a two-sample test of the mean, the null hypothesis H. 0. is a simple statement about the value the difference in the means is expected to have. As an example, let us say that a randomized two-arm trial in post-surgery/ radiation head and neck cancer patients is planned, with a 2:1 ratio of resveratrol (an antioxidant

Tests for Standard Deviations (Two or More Samples)
support.minitab.comsample designs and k-sample designs with k > 2 as multiple-sample designs. Generally, these two types of designs are studied separately (see Appendix A). Because the standard deviation is the square root of the variance, a hypothesis test that compares standard deviations is equivalent to a hypothesis test that compares variances. Many

Assistant Two Sample - Support | Minitab
support.minitab.comclassical 2-sample t-test is used when two samples have different variances, the test is more likely to produce incorrect results. Welch’s t-test is a viable alternative to the classical t-test because it does not assume equal variances and therefore is insensitive to unequal variances for all sample sizes. However, Welch’s

Comparative Essay Sample: Two Books
www.5staressays.comComparative Essay Sample: Two Books Literature, just like any other form of art, is a good historical mirror – books work as an informative reflection of social life and historical events of certain era. It is obvious that works of every period in the world history have something in common, demonstrating a cultural movement or context.

Two tails of Z - San Jose State University
www.sjsu.eduPage 1 of 1 of C:\data\StatPrimer\z-two-tails.doc Last printed 4/7/2007 10:47:00 AM Two tails of Z Entries in the table represent two-tailed P values for z statistics hundredths

Two-Sample Problems - University of West Georgia
www.westga.eduThe Two-Sample t Statistic When data come from two random samples or two groups in a randomized experiment, the difference between the sample means ( ̅ ̅ ) is the best estimate of the difference between the population means ( ). In other words, since the population means ( and ) are unknown, the
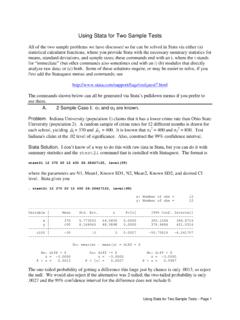
Using Stata for Two Sample Tests - University of Notre …
www3.nd.eduB. 2 Sample Case II: σ 1 and σ 2 are unknown but assumed to be equal. 1. A professor believes that women do better on her exams than men do. A sample of 8 women (N1 = 8) and 10 men (N2 = 10) yields µˆ 1 = 7, 2 µˆ = 5.5, s1 2 = 1, s2 2= 1.7. (a) Using α = .01, test whether the female mean is greater than the male mean.