
Chapter 305 Multiple Regression - Statistical Software
Multiple Regression Introduction Multiple Regression Analysis refers to a set of techniques for studying the straight-line relationships among two or more variables. Multiple regression estimates the β’s in the equation y =β 0 +β 1 x 1j +βx 2j + +β p x pj +ε j The X’s are the independent variables (IV’s). Y is the dependent variable.
Download Chapter 305 Multiple Regression - Statistical Software

Information
Domain:
Source:
Link to this page:
Documents from same domain

Mixed Models - Repeated Measures - Statistical …
ncss-wpengine.netdna-ssl.comMixed Models – Repeated Measures Introduction ... analysis, and the amount of data available for the analysis. When more than one fixed factor may influence the

Repeated Measures Analysis - NCSS
ncss-wpengine.netdna-ssl.comThis section provides the technical details of the repeated measures designs that can be analyzed by PASS. Earlier ... Repeated Measures Analysis ...

Chapter 469 Decomposition Forecasting - NCSS
ncss-wpengine.netdna-ssl.comChapter 469 Decomposition Forecasting Introduction Classical time series decomposition separates a time series into five components: mean, long-range trend, seasonality, cycle, and randomness. The decomposition model is Value = (Mean) x (Trend) x (Seasonality) x (Cycle) x (Random).

Chapter 575 Probit Analysis - Statistical Software
ncss-wpengine.netdna-ssl.comChapter 575 Probit Analysis Introduction Probit Analysis is a method of analyzing the relationship between a stimulus (dose) and the quantal (all or nothing) response. Quantitative responses are almost always preferred, but in many situations they are not practical. In these cases, it is only possible to determine if a certain response (such as ...

Chapter 720 Probit Analysis - Statistical Software
ncss-wpengine.netdna-ssl.comChapter 720 Probit Analysis. Introduction . Probit and logit analysis may be used for comparative LD. 50. studies for testing the efficacy of drugs designed to prevent lethality. This program module presents calculates power and sample size using the methodology outlined

Chapter 311 Stepwise Regression - Statistical Software
ncss-wpengine.netdna-ssl.comNCSS Statistical Software NCSS.com © NCSS, LLC. All Rights Reserved.

Chapter 208 Paired T-Test - NCSS
ncss-wpengine.netdna-ssl.comNCSS Statistical Software NCSS.com Paired T-Test 208-6 © NCSS, LLC. All Rights Reserved. Tests Alpha Alpha is the significance leve l used in the hypothesis tests.

Multivariate Analysis of Variance (MANOVA)
ncss-wpengine.netdna-ssl.comNCSS Statistical Software NCSS.com Multivariate Analysis of Variance (MANOVA) 415-4 © NCSS, LLC. All Rights Reserved. Assumptions and Limitations

Chapter 194 Normality Tests - NCSS
ncss-wpengine.netdna-ssl.comNCSS Statistical Software NCSS.com © NCSS, LLC. All Rights Reserved.

Distribution Weibull Fitting - NCSS
ncss-wpengine.netdna-ssl.comDistribution (Weibull) Fitting Introduction This procedure estimates the parameters of the exponential, extreme value, logistic, log-logistic, lognormal, normal, and Weibull probability distributions by maximum likelihood. It can fit complete, right censored, left censored, interval censored (readou t), and grouped data values.
Related documents
MULTIPLE REGRESSION BASICS - New York University
people.stern.nyu.eduMULTIPLE REGRESSION BASICS Documents prepared for use in course B01.1305, New York University, Stern School of Business Introductory thoughts about multiple regression page 3 Why do we do a multiple regression? What do we expect to learn from it? What is the multiple regression model? How can we sort out all the notation?

Multiple Regression - University of California, Berkeley
www.stat.berkeley.eduSecond, multiple regression is an extraordinarily versatile calculation, underly-ing many widely used Statistics methods. A sound understanding of the multiple regression model will help you to understand these other applications. Third, multiple regression offers our first glimpse into statistical models that use more than two quantitative ...
Multiple Regression Analysis - SAGE Publications Inc
us.sagepub.comMultiple Regression Analysis 5A.1 General Considerations Multiple regression analysis, a term first used by Karl Pearson (1908), is an extremely useful extension of simple linear regression in that we use several quantitative (metric) or dichotomous variables in -
Multiple Linear Regression - Johns Hopkins University
blackboard.jhu.eduMultiple Linear Regression • A multiple linear regression model shows the relationship between the dependent variable and multiple (two or more) independent variables • The overall variance explained by the model (R2) as well as the unique contribution (strength and direction) of each independent variable can be obtained

Chapter 3 Multiple Linear Regression Model The linear model
home.iitk.ac.inRegression Analysis | Chapter 3 | Multiple Linear Regression Model | Shalabh, IIT Kanpur 2 iii) 2 yXX 01 2 is linear in parameters 01 2,and but it is nonlinear is variables X.So it is a linear model iv) 1 0 2 y X is nonlinear in the parameters and variables both.
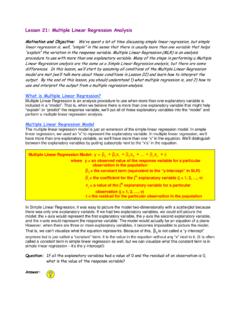
Lesson 21: Multiple Linear Regression Analysis
courses.ecampus.oregonstate.eduMultiple Linear Regression is an analysis procedure to use whe n more than one explanatory variable is included in a “model”. That is, when we believe there is more than one explanatory variable that might help “explain” or “predict” the response variable, we’ll put all of these explanatory variables into the “model” and ...

Analysis of Variance for Regression/Multiple Regression
www-stat.wharton.upenn.eduMultiple Linear Regression Model One possible model for the population regression function is the multiple linear regression model, an analogue of the simple linear regression model: " " Interpretation of: The change in the mean of if is increased by one unit and all other explanatory variables, " are held fixed.

Multiple Regression Using SPSS - Miami
sites.education.miami.eduJun 03, 2020 · Multiple Regression Using SPSS APA Format Write-up A multiple linear regression was fitted to explain exam score based on hours spent revising, anxiety score, and A-Level entry points. All of the assumptions were met except the autocorrelation assumption between residuals. The overall model explains 86.0% variation of exam score, and it

Multiple Regression - Open University
www.open.ac.ukMultiple Regression Regression allows you to investigate the relationship between variables. But more than that, it allows you to model the relationship between variables, which enables you to make predictions about what one variable will do based on the scores of some other variables.