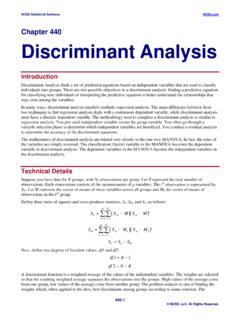
Chapter 440 Discriminant Analysis - NCSS
Discriminant analysis assumes linear relations among the independent variables. You should study scatter plots of each pair of independent variables, using a different color for each group. Look carefully for curvilinear patterns and for outliers. The occurrence of a curvilinear relationship will reduce the power and the discriminating ability
Download Chapter 440 Discriminant Analysis - NCSS

Information
Domain:
Source:
Link to this page:
Documents from same domain

Mixed Models - Repeated Measures - Statistical …
ncss-wpengine.netdna-ssl.comMixed Models – Repeated Measures Introduction ... analysis, and the amount of data available for the analysis. When more than one fixed factor may influence the

Repeated Measures Analysis - NCSS
ncss-wpengine.netdna-ssl.comThis section provides the technical details of the repeated measures designs that can be analyzed by PASS. Earlier ... Repeated Measures Analysis ...

Chapter 469 Decomposition Forecasting - NCSS
ncss-wpengine.netdna-ssl.comChapter 469 Decomposition Forecasting Introduction Classical time series decomposition separates a time series into five components: mean, long-range trend, seasonality, cycle, and randomness. The decomposition model is Value = (Mean) x (Trend) x (Seasonality) x (Cycle) x (Random).

Chapter 575 Probit Analysis - Statistical Software
ncss-wpengine.netdna-ssl.comChapter 575 Probit Analysis Introduction Probit Analysis is a method of analyzing the relationship between a stimulus (dose) and the quantal (all or nothing) response. Quantitative responses are almost always preferred, but in many situations they are not practical. In these cases, it is only possible to determine if a certain response (such as ...

Chapter 720 Probit Analysis - Statistical Software
ncss-wpengine.netdna-ssl.comChapter 720 Probit Analysis. Introduction . Probit and logit analysis may be used for comparative LD. 50. studies for testing the efficacy of drugs designed to prevent lethality. This program module presents calculates power and sample size using the methodology outlined

Chapter 311 Stepwise Regression - Statistical Software
ncss-wpengine.netdna-ssl.comNCSS Statistical Software NCSS.com © NCSS, LLC. All Rights Reserved.

Chapter 208 Paired T-Test - NCSS
ncss-wpengine.netdna-ssl.comNCSS Statistical Software NCSS.com Paired T-Test 208-6 © NCSS, LLC. All Rights Reserved. Tests Alpha Alpha is the significance leve l used in the hypothesis tests.

Multivariate Analysis of Variance (MANOVA)
ncss-wpengine.netdna-ssl.comNCSS Statistical Software NCSS.com Multivariate Analysis of Variance (MANOVA) 415-4 © NCSS, LLC. All Rights Reserved. Assumptions and Limitations

Chapter 194 Normality Tests - NCSS
ncss-wpengine.netdna-ssl.comNCSS Statistical Software NCSS.com © NCSS, LLC. All Rights Reserved.

Distribution Weibull Fitting - NCSS
ncss-wpengine.netdna-ssl.comDistribution (Weibull) Fitting Introduction This procedure estimates the parameters of the exponential, extreme value, logistic, log-logistic, lognormal, normal, and Weibull probability distributions by maximum likelihood. It can fit complete, right censored, left censored, interval censored (readou t), and grouped data values.
Related documents
Statistical Data Analysis - Sherry Towers
www.sherrytowers.com4.4.1 Linear test statistics, the Fisher discriminant func-tion 51 4.4.2 Nonlinear test statistics, neural networks 54 4.4.3 Selection of input variables 56 4.5 Goodness-of-fit tests 57 4.6 The significance of an observed signal 59 4.7 Pearson 's X2 test 61 5 General concepts of parameter estimation 64 5.1 Samples, estimators, bias 64

JMP Start Statistics: A Guide to Statistics and Data ...
support.sas.comA Discriminant Alternative 326 Inverse Prediction 327 Polytomous (Multinomial) Responses: More Than Two Levels 330 Ordinal Responses: Cumulative Ordinal Logistic Regression 331 Surprise: Simpson’s Paradox: Aggregate Data versus Grouped Data 334 Generalized Linear Models 337 Exercises 342 13 Multiple Regression 345 Overview 345

POST GRADUATE PROGRAM IN
d9jmtjs5r4cgq.cloudfront.netTechniques used: Linear Discriminant Analysis, Logistic Regression, Neural Network, Boosting, Random Forest, CART Healthcare Prediction of user’s mood using smartphone data Techniques used: Logistic Regression, Random Tree, ADA Boost, Random Forest, KSVM Insurance Personal insurance digital assistant Techniques used: NLP (Natural Language

DATA MINING AND ANALYSIS - doc.lagout.org
doc.lagout.orgdata analysis, and complex graphs and networks. It integrates concepts from related disciplines such as machine learning and statistics and is also ideal for a course on data analysis. Most of the prerequisite material is covered in the text, especially …

MULTIVARIATE ANALYSES INTRODUCTION Examples …
www.ndsu.edu• Discriminant analysis: In an original survey of males for possible factors that can be used to predict heart disease, the researcher wishes to determine a linear function of the many putative causal factors that would be useful in predicting those individuals that
Quantitative Data Analysis: Choosing Between SPSS, PLS and ...
iijsr.orgIn the context of Discriminant Analysis, it is conducted when the entire set of independent variables measurement is at least at the interval level (Johnson and Wichern, 2007; Tabachnick and Fidell, 2007; El-Sayed and Hamed, 2015), whereas Logistic Regression analysis or Multinomial Regression analysis are the statistical tools utilized if there

Neural Networks and Statistical Models - Cornell University
people.orie.cornell.educluster analysis. Introduction Neural networks are a wide class of flexible nonlinear regression and discriminant models, data reduction models, and nonlinear dynamical systems. They consist of an often large number of “neurons,” i.e. simple linear or nonlinear computing elements, interconnected in often complex ways and often organized ...

Partial Least Squares Regression
vision.cse.psu.edu• Train a Quadratic Discriminant Analysis (QDA) classifier in the 20 dimensional latent space. Noted you could also use SVM, but since PLS gives good separability between classes, it is possible to use the simpler (and less expensive) classifier. • Compared
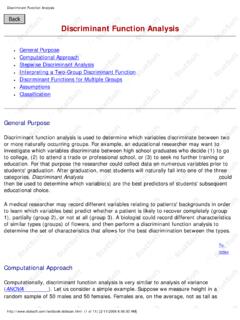
Discriminant Function Analysis - USDA
www.aphis.usda.govanalysis is also called Fisher linear discriminant analysis after Fisher, 1936; computationally all of these approaches are analogous). If we code the two groups in the analysis as 1 and 2 , and use that variable as the dependent variable in a multiple regression analysis, then we would get results that are analogous to those we would obtain ...