
Chapter 469 Decomposition Forecasting
Step 2 – Calculate a Moving Average The next step calculates an L-step moving average centered at the time period, t, where L is the length of the seasonality (e.g., L would be 12 for a monthly series or 4 for quarterly series). Since the moving average gives the mean of a year’s data, the seasonality factor is removed.
Download Chapter 469 Decomposition Forecasting

Information
Domain:
Source:
Link to this page:
Documents from same domain

Mixed Models - Repeated Measures - Statistical …
ncss-wpengine.netdna-ssl.comMixed Models – Repeated Measures Introduction ... analysis, and the amount of data available for the analysis. When more than one fixed factor may influence the

Repeated Measures Analysis - NCSS
ncss-wpengine.netdna-ssl.comThis section provides the technical details of the repeated measures designs that can be analyzed by PASS. Earlier ... Repeated Measures Analysis ...

Chapter 575 Probit Analysis - Statistical Software
ncss-wpengine.netdna-ssl.comChapter 575 Probit Analysis Introduction Probit Analysis is a method of analyzing the relationship between a stimulus (dose) and the quantal (all or nothing) response. Quantitative responses are almost always preferred, but in many situations they are not practical. In these cases, it is only possible to determine if a certain response (such as ...

Chapter 720 Probit Analysis - Statistical Software
ncss-wpengine.netdna-ssl.comChapter 720 Probit Analysis. Introduction . Probit and logit analysis may be used for comparative LD. 50. studies for testing the efficacy of drugs designed to prevent lethality. This program module presents calculates power and sample size using the methodology outlined

Chapter 311 Stepwise Regression - Statistical Software
ncss-wpengine.netdna-ssl.comNCSS Statistical Software NCSS.com © NCSS, LLC. All Rights Reserved.

Chapter 208 Paired T-Test - NCSS
ncss-wpengine.netdna-ssl.comNCSS Statistical Software NCSS.com Paired T-Test 208-6 © NCSS, LLC. All Rights Reserved. Tests Alpha Alpha is the significance leve l used in the hypothesis tests.

Multivariate Analysis of Variance (MANOVA)
ncss-wpengine.netdna-ssl.comNCSS Statistical Software NCSS.com Multivariate Analysis of Variance (MANOVA) 415-4 © NCSS, LLC. All Rights Reserved. Assumptions and Limitations

Chapter 194 Normality Tests - NCSS
ncss-wpengine.netdna-ssl.comNCSS Statistical Software NCSS.com © NCSS, LLC. All Rights Reserved.

Distribution Weibull Fitting - NCSS
ncss-wpengine.netdna-ssl.comDistribution (Weibull) Fitting Introduction This procedure estimates the parameters of the exponential, extreme value, logistic, log-logistic, lognormal, normal, and Weibull probability distributions by maximum likelihood. It can fit complete, right censored, left censored, interval censored (readou t), and grouped data values.
Chapter 440 Discriminant Analysis
ncss-wpengine.netdna-ssl.comChapter 440 Discriminant Analysis Introduction Discriminant Analysis finds a set of prediction equations based on independent variables that are used to classify individuals into groups. There are two possible objectives in a discriminant analysis: finding a predictive equation
Related documents
A practical Time -Series Tutorial with MATLAB
alumni.cs.ucr.edu2 Tutorial | Time-Series with Matlab 3 Disclaimer I am not affiliated with Mathworks in any way … but I do like using Matlab a lot – since it makes my life easier Errors and bugs are most likely contained in this tutorial.
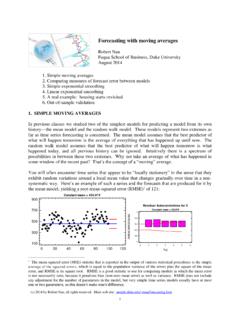
Forecasting with moving averages - Duke University
people.duke.edu3 which a moving average might be computed, but the most obvious is to take a simple average of the most recent m values, for some integer m. This is the so-called simple moving average model (SMA), and its equation for predicting the value of …

FUNDAMENTALS OF BUSINESS MATHEMATICS AND
icmai.inDemonstrate to explain the relevance and use of statistical tools for analysis and forecasting: Skill sets required: ... 8. Time Series Analysis – basic application including Moving Average (a) Moving Average Method (b) Method of Least Squares ... 8.5 Method of Semi Averages 8.3 8.6 Moving Average Method 8.3 8.7 Method of Least Squares 8.6 ...

Supply Chain Management: Forcasting techniques and …
www2.unb.caOne disadvantage of using moving averages for forecasting is that in calculating the average all the observations are given equal weight (namely 1/L), whereas we would expect the more recent observations to be a better indicator of the future (and accordingly ought to be given greater weight). Also in moving

The Traditional Four Steps Transportation Modeling Using ...
discovery.ucl.ac.ukTravel forecasting models are used to predict changes in travel patterns and the utilization of the ... Trip generation uses trip rates that are averages for large segment of the study area. Trip ... The difficulty of moving from one node to another in a network is the link impedance. Impedance

Management Accounting (MA/FMA)
www.accaglobal.comj) Calculate moving averages.[S] k) Calculate the trend, including the use of regression coefficients.[S] l) Use trend and seasonal variation (additive and multiplicative) to make budget forecasts.[S] m) Explain the advantages and disadvantages of time series analysis.[K] n) Explain the purpose of index numbers.[K] and multi-item

Syllabus AI and Artificial Intelligence and Machine …
www.nitw.ac.inUnit 15: Forecasting models Ÿ Trend analysis Ÿ Cyclical and Seasonal analysis Ÿ Smoothing; Moving averages; Box-Jenkins, Holt-winters, Auto-correlation; ARIMA Ÿ Examples: Applications of Time Series in financial markets Module 4: Predictive Analytics Pre d i ctive Anal yti cs

Fast-Moving, Slow-Moving and Non-Moving Inventory (FSN ...
www.orderhive.comFast-Moving, Slow-Moving and Non-Moving Inventory (FSN technique) ... Although it is a bitter truth, it’s true that the industry with good demand forecasting and ... you need to take both averages stays in inventory and consumption rate of the …