Chapter 6 Importance sampling
The sampling distribution is an exponential shifted to the right by 4. In other words, if Y has an exponential distribution with mean 1, then Y +4 has the distribution q.
Download Chapter 6 Importance sampling

Information
Domain:
Source:
Link to this page:
Documents from same domain
Joint and Marginal Distributions - University of Arizona
www.math.arizona.eduJoint and Marginal Distributions October 23, 2008 We will now consider more than one random variable at a time. As we shall see, developing the theory of multivariate distributions will allow us to consider situations that model the actual collection of data and form the foundation of inference based on those data. 1 Discrete Random Variables
1 Sufficient statistics
www.math.arizona.educonditional distribution. But then his random sample has the same distri-bution as a random sample drawn from the population (with its unknown value of θ). So statistician B can use his random sample X0 1,···,X0 n to com-pute whatever statistician A computes using his random sample X1,···,Xn, and he will (on average) do as well as ...
A Conditional expectation
www.math.arizona.eduThe partition theorem says that if Bn is a partition of the sample space then E[X] = X n E[XjBn]P(Bn) Now suppose that X and Y are discrete RV’s. If y is in the range of Y then Y = y is a event with nonzero probability, so we can use it as the B in the above.
Method of Moments - University of Arizona
www.math.arizona.eduThe muon is an elementary particle with an electric charge of 1 and a spin (an intrinsic angular momentum) of 1/2. It is an unstable subatomic particle with a mean lifetime of 2.2 µs. Muons have a mass of about 200 times the mass of an electron. Since the muon’s charge and spin are the same as the electron, a muon can be

Topic 15 Maximum Likelihood Estimation
www.math.arizona.eduMaximum Likelihood Estimation Multidimensional Estimation 1/10. Fisher Information Example Outline Fisher Information Example Distribution of Fitness E ects ... To obtain the maximum likelihood estimate for the gamma family of random variables, write the likelihood L( ; jx) = ( ) x 1 1 e x1 ( ) x 1 n e xn = ( ) n (x 1x 2 x
Maximum Likelihood Estimation - University of Arizona
www.math.arizona.eduIntroduction to the Science of Statistics Maximum Likelihood Estimation 0.2 0.3 0.4 0.5 0.6 0.7 0.0e+00 5.0e-07 1.0e-06 1.5e-06 p l 0.2 0.3 0.4 0.5 0.6 0.7
Topic 15: Maximum Likelihood Estimation
www.math.arizona.eduIntroduction to Statistical Methodology Maximum Likelihood Estimation Exercise 3. Check that this is a maximum. Thus, p^(x) = x: In this case the maximum likelihood estimator is also unbiased. Example 4 (Normal data). Maximum likelihood estimation can be applied to a vector valued parameter. For a simple
Innovative Methods of Teaching - University of Arizona
www.math.arizona.eduThe reason being that martyr is engaged in defense work while an alim (scholar) builds individuals and nations along positive lines. In this way he bestows a real life to the world. “Education is the manifestation of perfection already in man” – (Swami Vivekananda)
Probability Theory - University of Arizona
www.math.arizona.eduProbability Theory December 12, 2006 Contents 1 Probability Measures, Random Variables, and Expectation 3 ... Definition 1.18. Let f : (S,S) → (T,T ) be a function between measure spaces, then f is called measurable if f−1(B) ∈ S for every B ∈ T . (1.6) If (S,S) has a probability measure, then f is called a random variable.

Interval Estimation - University of Arizona
www.math.arizona.edulikelihood, and evaluate the quality of the estimator by evaluating the bias and the variance of the estimator. Often, we know more about the distribution of the estimator and this allows us to take a more comprehensive statement about the estimation procedure. Interval estimation is an alternative to the variety of techniques we have examined.
Related documents

Importance Sampling - Statistics
dept.stat.lsa.umich.eduimportance sampling is useful here. In other cases, such as when you want to evaluate E(X) where you can’t even generate from the distribution of X, importance sampling is necessary. The final, and most crucial, situation where importance sampling is useful is when you want to generate from a density you only know up to a multiplicative ...

Solutions to Homework 3 Statistics 302 Professor Larget
pages.stat.wisc.edumean to be higher. We estimate the mean to be about 40 million or 45 million. This is the mean of a sample, so we have xis approximately 45 million dollars. (c) Boxplot A shows the data from a sampling distribution using samples of size 30. Each data value represents the mean of one of these samples. There are 1000 means included in the distri ...
Practice Exam Questions; Statistics 301; Professor Wardrop
pages.stat.wisc.edu(e) Refer to (d). Calculate the mean of Ralph’s new data set. 4. Sarah performs a CRD with a dichotomous re-sponse and obtains the following data. Treatment S F Total 1 a b 18 2 c d 12 Total 8 22 30 Next, she obtains the sampling distribution of the test statistic for Fisher’s test for her data; it is given below. x P(X = x) P(X ≤ x) P(X ...
Normal Distribution, Confidence Intervals for the Mean ...
webspace.ship.eduFor smallish sample sizes we use the t distribution. T distribution: a symmetric distribution, more peaked than the normal distribution, that is completely described by its mean and standard deviation for . k degrees of freedom or df (we will discuss this term in more detail later). The . df. for confidence intervals is . n-1. So for our ...
Designing a Statistically Sound Sampling Plan
www.statisticaloutsourcingservices.comSampling Plans zSimple Random Sample zEach sampling unit has an equal probability of being sampled with each selection. zCan perform simple random sampling if: zEnumerate every unit of the population zRandomly select n of the numbers and the sample consists of the units with those IDs zOne way to do this is to use a random number table or random number generator
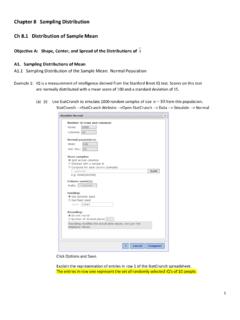
Chapter 8 Sampling Distribution Ch 8.1 Distribution of ...
mymission.lamission.eduA1. Sampling Distributions of Mean A1.2 Sampling Distribution of the Sample Mean: Non-normal Population Example 1: The waiting time in line can be modeled by an exponential distribution which is similar to skewed to the right with a mean of 5 minutes and a standard deviation of 5 minutes.
The Truncated Normal Distribution
people.sc.fsu.edu1.5 Sampling the Normal Distribution Sampling a distribution means to select one item from the range of legal values, using the PDF as the probability of selection. A histogram of the selected data should roughly approximate the shape of a graph of the PDF. Assuming we have some function rand() which is a source of uniform random numbers in the ...

Estimating Population Size & Distribution
www.deanza.eduthe mean number of individuals per quadrat. This gives us a reliable way to measure aggregation. Statisticians have demonstrated that the variance/mean ratio, x, yields a value close to 1 in a randomly dispersed population, because in samples from a random distribution the variance is equal to the mean.

RECOMMENDED METHODS OF SAMPLING FOR THE …
www.fao.orgdistribution, the units should be allocated randomly to replicate laboratory samples at the time of taking the primary samples. In this case, the result to be used should be the mean of valid results obtained from the laboratory samples analyzed. 3.4 Preparation of the laboratory sample