CHAPTER 8. RANDOMIZED COMPLETE BLOCK DESIGN …
MSEB is the mean square of design-B with degrees of freedom dfB. If RE>1, design A is more efficient. If RE<1, the converse is true. If a randomized complete block design (say, design-A) is used, one may want to estimate the relative efficiency compared with a completely randomized design (say, design-B).
Download CHAPTER 8. RANDOMIZED COMPLETE BLOCK DESIGN …

Information
Domain:
Source:
Link to this page:
Documents from same domain
P(Z Cumulative Probabilities of the Standard …
pages.stat.wisc.eduCumulative Probabilities of the Standard Normal Distribution N(0, 1) Left-sided area Left-sided area Left-sided area Left-sided area Left-sided area Left-sided area
Classification and regression trees
pages.stat.wisc.eduOverview Classification and regression trees Wei-Yin Loh Classificationandregressiontreesaremachine-learningmethodsforconstructing predictionmodelsfromdata ...

BASIC CALCULUS REFRESHER - pages.stat.wisc.edu
pages.stat.wisc.edu3 y = x y = x2 Notice that the line has the generic equation y = f (x) = mx + b, where b is the Y-intercept (in this example, b = +3), and m is the slope of the line (in this example, m = +2). In general, the slope of any line is defined as the ratio of “height change” y to “length change” x, that is, m = y
Solutions to Homework 5 Statistics 302 Professor Larget
pages.stat.wisc.eduSolutions to Homework 5 Statistics 302 Professor Larget Textbook Exercises 4.79 Divorce Opinions and Gender In Data 4.4 on page 227, we introduce the results of a May 2010 Gallup poll of 1029 US adults. When asked if they view divorce as \morally acceptable", 71% of the men and 67% of the women in the sample responded yes. In the test for a di ...
Using lme4: Mixed-Effects Modeling in R
pages.stat.wisc.eduDe nition of linear mixed-e ects models A mixed-e ects model incorporates two vector-valued random variables: the response, Y, and the random e ects, B. We observe the value, y, of Y. We do not observe the value of B. In a linear mixed-e ects model the conditional distribution, YjB, and the marginal distribution, B, are independent,
Applications of Fourier Transform to Imaging Analysis
pages.stat.wisc.eduCallosum (CC) data are used to demonstrate the advantages of our method over previous methods. The possibilities of applications of this method to image analysis is discussed. 1 Introduction Fourier transform (FT) is named in the honor of Joseph Fourier (1768-1830), one of greatest names in the history of mathematics and physics.
Solutions to Homework 1 Statistics 302 Professor Larget
pages.stat.wisc.eduselected. Other options are possible: for example, we could number the plants from 1 to 30000 and randomly select 30 numbers between 1 and 30000. (b) Answers will vary for this question, but the procedure should be explained and the three numbers which were obtained should be listed. Here is the start of one sample. Row Plant #94 #180 #83 # 81 ...

3. The Gaussian kernel
pages.stat.wisc.eduThe Gaussian kernel is defined in 1-D, 2D and N-D respectively as ... process of observation s can never become zero. For, this would imply making an observation through an infinitesimally small aperture, which is impossible. The factor of 2 in the exponent is a matter of convention,
Practice Exam Questions; Statistics 301; Professor Wardrop
pages.stat.wisc.edu13. A sample space has three possible outcomes, B, C, and D. It is known that P(C) = P(D). The operation of the chance mechanism is simulated 10,000 times (runs). The sorted frequencies of the three outcomes (B, C, and D) are: 2322, 2360, and 5318. (a) What is your approximation of P(B)? To receive credit you must explain your an-swer.
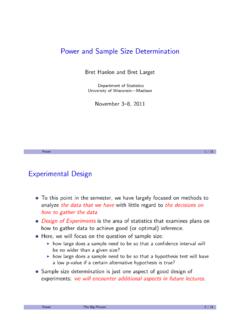
Power and Sample Size Determination
pages.stat.wisc.eduPower and Sample Size Determination Bret Hanlon and Bret Larget Department of Statistics University of Wisconsin|Madison November 3{8, 2011 Power 1 / 31 Experimental Design To this point in the semester, we have largely focused on methods to analyze the data that we have with little regard to the decisions on how to gather the data.
Related documents
Chapter 4 Experimental Designs and Their Analysis
home.iitk.ac.inCompletely randomized design (CRD) The CRD is the simplest design. Suppose there are v treatments to be compared. All experimental units are considered the same and no division or grouping among them exist. In CRD, the v treatments are allocated randomly to the whole set of experimental units, without
Introduction to Biostatistics
users.stat.ufl.edu6.1 Completely Randomized Design (CRD) For Parallel Groups Studies . . . . . . . . . 97 ... 8 CHAPTER 1. INTRODUCTION PO6 Positive or negative result of all pregnant women who would ever use a particular brand of home pregnancy test. Samples are observed sets of measurements that are subsets of a corresponding population.

A First Course in Design and Analysis of Experiments
users.stat.umn.eduxii CONTENTS 13 Complete Block Designs 315 13.1 Blocking . . . . . . . . . . . . . . . . . . . . . . . . . . . 315 13.2 The Randomized Complete Block Design ...

METHODS AND TECHNIQUES RESEARCH C R KOTHARI
newagepublishers.com3.7.2 After-Only with Control Design 40 3.7.3 Before-and-After with Control Design 41 3.7.4 Completely Randomized Design (C.R. Design) 41 3.7.5 Randomized Block Design (R.B. Design) 44 3.7.6 Latin Square Design (L.S. Design) 45 3.7.7 Factorial Designs 46 3.8 Conclusion 51 Problems 51 4. Design of Sample Surveys 52 4.1 Introduction 52 4.2 Sample ...
The ANOVA Procedure - SAS
support.sas.comabout ODS graphics, see the section “ODS Graphics” on page 982 and Chapter 21, “Statistical Graphics Using ODS.” Getting Started: ANOVA Procedure The following examples demonstrate how you can use the ANOVA procedure to perform analyses of variance for a one-way layout and a randomized complete block design. One-Way Layout with Means ...
<1034> ANALYSIS OF BIOLOGICAL ASSAYS
www.drugfuture.comtion chapter Design and Development of Biological Assays terval). ... Models for quantitative re-only to completely randomized designs. Any other design sponses can be linear or nonlinear (see sections 3.2–3.5). will mean additional terms in the statistical model. For ex-

Chapter 6 Randomized Block Design Two Factor ANOVA ...
www.ics.uci.eduFactorial Design Assume: Factor A has K levels, Factor B has J levels. To estimate an interaction effect, we need more than one observation for each combination of factors. Let n kj = sample size in (k,j)thcell. Definition: For a balanced design, n kj is constant for all cells. n kj = n n = 1 in a typical randomized block design n > 1 in a ...

AP Statistics Chapter 4 Test Review
www.somerset.k12.ky.uslength of hospital stay (3 days or less, 3-7 days, 8-14 days, more than 14 days). Draw simple random samples from each group. #7. Obtain lists of patients discharged from all MMH facilities. Number these patients, and then use a random number table to obtain the sample. #8.