![[CM] Choice Models - Stata](/cache/preview/0/8/e/c/b/0/5/f/thumb-08ecb05f4228daa051167744e21d9968.jpg)
[CM] Choice Models - Stata
Effects of a continuous covariate Effects of a categorical covariate Effects of an alternative-specific covariate More inferences using margins Interpretation of coefficients We demonstrate with a transportation example. We have 210 individuals who choose a method of travel between two cities—by airplane, train, bus, or car.
Download [CM] Choice Models - Stata

Information
Domain:
Source:
Link to this page:
Documents from same domain

Syntax - Stata
www.stata.com2cluster kmeans and kmedians— Kmeans and kmedians cluster analysis Options Main k(#) is required and indicates that # groups are to be formed by the cluster analysis.

Syntax Description - Stata
www.stata.com2substr()— Extract substring Diagnostics In substr(s, b, l) and substr(s, b), if b describes a position before the beginning of the string or after the end, "" is returned.

Title stata.com generate — Create or change …
www.stata.comTitle stata.com generate — Create or change contents of variable SyntaxMenuDescriptionOptions Remarks and examplesMethods and formulasReferencesAlso see Syntax Create new variable generate type newvar

SyntaxDescriptionRemarks and examplesAlso see
www.stata.commacro— Macro definition and manipulation 3 Macro extended functions related to matrices rownamesjcolnamesjrowfullnamesjcolfullnames matname roweqjcoleq

Title stata.com graph box — Box plots
www.stata.comgraph box— Box plots 3 Menu Graphics > Box plot Syntax graph box yvars if in weight, options graph hbox yvars if in weight, options where yvars is a varlist options Description

Title stata
www.stata.comarea options — Options for specifying the look of special areas 3 Also see [G-2] graph dot — Dot charts (summary statistics)

www.stata.com
www.stata.com2cluster dendrogram— Dendrograms for hierarchical cluster analysis The height of the vertical lines and the range of the (dis)similarity axis give visual clues about the

Title stata.com putexcel — Export results to an Excel …
www.stata.computexcel— Export results to an Excel file 3 export options Description Main overwritefmt overwrite existing cell formatting when exporting new content

destring — Convert string variables to numeric ... - …
www.stata.comTitle stata.com destring — Convert string variables to numeric variables and vice versa SyntaxMenuDescription Options for destringOptions for tostringRemarks and …

Title stata.com gettoken — Low-level parsing
www.stata.comTitle stata.com gettoken — Low-level parsing SyntaxDescriptionOptionsRemarks and examplesAlso see Syntax gettoken emname1 emname2: emname3, parse("pchars") quotes qed(lmacname) match(lmacname) bind
Related documents
Teaching Methods and Students’ Academic Performance
www.ijhssi.orgAccording to Ayeni (2011), teaching is a continuous process that involves bringing about desirable changes in learners through use of appropriate methods. Adunola (2011) indicated that in order to bring desirable changes in students, teaching methods used by educators should be best for the subject matter.
Analysis of Financial Time Series
cpb-us-w2.wpmucdn.com3.10.1 Effects of Explanatory Variables, 133 3.11 Random Coefficient Autoregressive Models, 133 3.12 The Stochastic Volatility Model, 134 3.13 The Long-Memory Stochastic Volatility Model, 134 3.14 Application, 136 3.15 Alternative Approaches, 140 3.15.1 Use of High-Frequency Data, 140 3.15.2 Use of Daily Open, High, Low, and Close Prices, 143
Organizational Commitment and Its Effects on ...
journal-archieves31.webs.comOrganizational Commitment and Its Effects on Organizational Performance MohammadAli Kashefi1, Reza Mahjoub Adel2, ... Commitment is an attitude about employees’ loyalty towards organization and it’s a continuous process that show ... his investments in it and marginal benefits which he earns by keeping on his activities in organization”.
The GENMOD Procedure - SAS
support.sas.comexplanatory variables, for observation i that is known from the experimental setting and is considered to be fixed, or nonrandom. The vector of unknown coefficients is estimated by a least squares fit to the data y. The "iare assumed to be independent, normal random variables with zero mean and constant variance. The
Syllabus for B.A. (Hons.) Economics - UGC
ugc.ac.inSyllabus for B.A. (Hons.) Economics Course Structure for B.A. (Hons.) Economics: There are a total of fourteen economics core courses that students are required to take across
Introduction to Econometrics - Pearson
www.pearsonhighered.comStandardized Random Variables 23 2.3 Two Random Variables 23 Joint and Marginal Distributions 23 Conditional Distributions 24 Independence 28 Covariance and Correlation 28 The Mean and Variance of Sums of Random Variables 29 A01_STOC1991_04_SE_FM_ppi-xlii.indd 7 22/08/18 3:13 PM
Section 13 Models for Pooled and Panel Data - Reed College
www.reed.eduo In this case, we can include that variable (for intercept effects) and perhaps interactions of that variable with some regressor Z (to capture effects on unemployment on the marginal effect of Z). o Interpretation of these coefficients is standard for continuous interaction variables. Limitations on variables that vary only over time
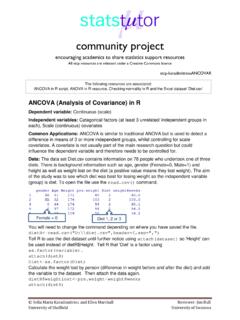
ANCOVA in R - University of Sheffield
www.sheffield.ac.ukDependent variable: Continuous (scale) Independent variables: Categorical factors (at least 3 unrelated/ independent groups in each), Scale (continuous) covariates. Common Applications: ANCOVA is similar to traditional ANOVA but is used to detect a difference in means of 3 or more independent groups, whilst controlling for scale covariates.