
Conditional Logistic Regression - NCSS
the deviance is calculated in multiple regression, it is equal to the sum of the squared residuals. The change in deviance, ∆D, due to excluding (or including) one or more variables is used in Cox regression just as the partial F test is used in multiple regression. Many texts use the letter G to represent∆D. Instead of using
Download Conditional Logistic Regression - NCSS

Information
Domain:
Source:
Link to this page:
Documents from same domain

Mixed Models - Repeated Measures - Statistical …
ncss-wpengine.netdna-ssl.comMixed Models – Repeated Measures Introduction ... analysis, and the amount of data available for the analysis. When more than one fixed factor may influence the

Repeated Measures Analysis - NCSS
ncss-wpengine.netdna-ssl.comThis section provides the technical details of the repeated measures designs that can be analyzed by PASS. Earlier ... Repeated Measures Analysis ...

Chapter 469 Decomposition Forecasting - NCSS
ncss-wpengine.netdna-ssl.comChapter 469 Decomposition Forecasting Introduction Classical time series decomposition separates a time series into five components: mean, long-range trend, seasonality, cycle, and randomness. The decomposition model is Value = (Mean) x (Trend) x (Seasonality) x (Cycle) x (Random).

Chapter 575 Probit Analysis - Statistical Software
ncss-wpengine.netdna-ssl.comChapter 575 Probit Analysis Introduction Probit Analysis is a method of analyzing the relationship between a stimulus (dose) and the quantal (all or nothing) response. Quantitative responses are almost always preferred, but in many situations they are not practical. In these cases, it is only possible to determine if a certain response (such as ...

Chapter 720 Probit Analysis - Statistical Software
ncss-wpengine.netdna-ssl.comChapter 720 Probit Analysis. Introduction . Probit and logit analysis may be used for comparative LD. 50. studies for testing the efficacy of drugs designed to prevent lethality. This program module presents calculates power and sample size using the methodology outlined

Chapter 311 Stepwise Regression - Statistical Software
ncss-wpengine.netdna-ssl.comNCSS Statistical Software NCSS.com © NCSS, LLC. All Rights Reserved.

Chapter 208 Paired T-Test - NCSS
ncss-wpengine.netdna-ssl.comNCSS Statistical Software NCSS.com Paired T-Test 208-6 © NCSS, LLC. All Rights Reserved. Tests Alpha Alpha is the significance leve l used in the hypothesis tests.

Multivariate Analysis of Variance (MANOVA)
ncss-wpengine.netdna-ssl.comNCSS Statistical Software NCSS.com Multivariate Analysis of Variance (MANOVA) 415-4 © NCSS, LLC. All Rights Reserved. Assumptions and Limitations

Chapter 194 Normality Tests - NCSS
ncss-wpengine.netdna-ssl.comNCSS Statistical Software NCSS.com © NCSS, LLC. All Rights Reserved.

Distribution Weibull Fitting - NCSS
ncss-wpengine.netdna-ssl.comDistribution (Weibull) Fitting Introduction This procedure estimates the parameters of the exponential, extreme value, logistic, log-logistic, lognormal, normal, and Weibull probability distributions by maximum likelihood. It can fit complete, right censored, left censored, interval censored (readou t), and grouped data values.
Related documents
Algorithms for Reinforcement Learning - University of Alberta
sites.ualberta.caonly partial feedback is given to the learner about the learner’s predictions. Further, the predictions may have long term e ects through in uencing the future state of the controlled system. Thus, time plays a special role. The goal in reinforcement learning is to develop e cient learning algorithms, as well as to understand the algorithms’

Covariance, Regression, and Correlation
nitro.biosci.arizona.eduregression line. That is, the least-squares solution yields the values of aand b that minimize the mean squared residual, e2. Other criteria could be used to de-fine \best fit." For example, one might minimize the mean absolute deviations (or cubed deviations) of observed values from predicted values. However, as we will now see, least ...

Partial Least Squares Structural ... - Massey University
marketing-bulletin.massey.ac.nzPartial Least Squares Structural Equation Modeling (PLS-SEM) Techniques Using SmartPLS . ... regression as it is different from PLS-SEM) until mid 2000s. The first generation of PLS-SEM software that was commonly used in the 1980s included LVPLS 1.8 but it was a DOS-based program. The subsequent arrival of PLS-Graph and VisualPLS added graphical a
Logistic Regression - Pennsylvania State University
personal.psu.eduLogistic Regression I The Newton-Raphson step is βnew = βold +(XTWX)−1XT(y −p) = (XTWX)−1XTW(Xβold +W−1(y −p)) = (XTWX)−1XTWz , where z , Xβold +W−1(y −p). I If z is viewed as a response and X is the input matrix, βnew is the solution to a weighted least square problem: βnew ←argmin β (z−Xβ)TW(z−Xβ) . I Recall that linear regression by least square is …

Mediation Analysiswith Logistic Regression
web.pdx.eduproduct is the partial regression coefficient of Y regressed on X when M is also in the model). In ordinary least squares regression, the difference between the direct effect of X on Y with and without M, c – c’ from separate regression models depicted in Figures 1.2 and 1.3 (Judd & Kenny, 1981), and the product
Regression Analysis - GitHub Pages
juejung.github.ioRegression Multiple Choice Identify the choice that best completes the statement or answers the question. ____ 1. Given the least squares regression line y8= 5− 2x: a. the relationship between x and y is positive. b. the relationship between x and y is negative. c. as x decreases, so does y. d. None of these choices. ____ 2.
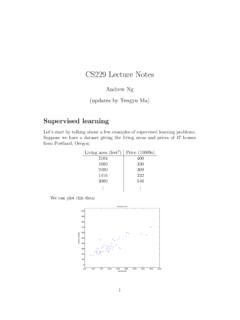
CS229LectureNotes - Stanford University
cs229.stanford.eduleast-squares cost function that gives rise to the ordinary least squares regression model. Whether or not you have seen it previously, let’s keep going, and we’ll eventually show this to be a special case of a much broader ... partial derivative term …