
Conditional Logistic Regression - NCSS
The deviance in Cox regression is analogous to the residual sum of squares in multiple regression. In fact, when the deviance is calculated in multiple regression, it is equal to the sum of the squared residuals. The change in deviance, ∆D, due to excluding (or including) one or more variables is used in Cox regression just
Download Conditional Logistic Regression - NCSS

Information
Domain:
Source:
Link to this page:
Documents from same domain

Mixed Models - Repeated Measures - Statistical …
ncss-wpengine.netdna-ssl.comMixed Models – Repeated Measures Introduction ... analysis, and the amount of data available for the analysis. When more than one fixed factor may influence the

Repeated Measures Analysis - NCSS
ncss-wpengine.netdna-ssl.comThis section provides the technical details of the repeated measures designs that can be analyzed by PASS. Earlier ... Repeated Measures Analysis ...

Chapter 469 Decomposition Forecasting - NCSS
ncss-wpengine.netdna-ssl.comChapter 469 Decomposition Forecasting Introduction Classical time series decomposition separates a time series into five components: mean, long-range trend, seasonality, cycle, and randomness. The decomposition model is Value = (Mean) x (Trend) x (Seasonality) x (Cycle) x (Random).

Chapter 575 Probit Analysis - Statistical Software
ncss-wpengine.netdna-ssl.comChapter 575 Probit Analysis Introduction Probit Analysis is a method of analyzing the relationship between a stimulus (dose) and the quantal (all or nothing) response. Quantitative responses are almost always preferred, but in many situations they are not practical. In these cases, it is only possible to determine if a certain response (such as ...

Chapter 720 Probit Analysis - Statistical Software
ncss-wpengine.netdna-ssl.comChapter 720 Probit Analysis. Introduction . Probit and logit analysis may be used for comparative LD. 50. studies for testing the efficacy of drugs designed to prevent lethality. This program module presents calculates power and sample size using the methodology outlined

Chapter 311 Stepwise Regression - Statistical Software
ncss-wpengine.netdna-ssl.comNCSS Statistical Software NCSS.com © NCSS, LLC. All Rights Reserved.

Chapter 208 Paired T-Test - NCSS
ncss-wpengine.netdna-ssl.comNCSS Statistical Software NCSS.com Paired T-Test 208-6 © NCSS, LLC. All Rights Reserved. Tests Alpha Alpha is the significance leve l used in the hypothesis tests.

Multivariate Analysis of Variance (MANOVA)
ncss-wpengine.netdna-ssl.comNCSS Statistical Software NCSS.com Multivariate Analysis of Variance (MANOVA) 415-4 © NCSS, LLC. All Rights Reserved. Assumptions and Limitations

Chapter 194 Normality Tests - NCSS
ncss-wpengine.netdna-ssl.comNCSS Statistical Software NCSS.com © NCSS, LLC. All Rights Reserved.

Distribution Weibull Fitting - NCSS
ncss-wpengine.netdna-ssl.comDistribution (Weibull) Fitting Introduction This procedure estimates the parameters of the exponential, extreme value, logistic, log-logistic, lognormal, normal, and Weibull probability distributions by maximum likelihood. It can fit complete, right censored, left censored, interval censored (readou t), and grouped data values.
Related documents

Introduction to Binary Logistic Regression
wise.cgu.edusquared in ordinary linear multiple regression. For example, pseudo R squared statistics developed by Cox & Snell and by Nagelkerke range from 0 to 1, but they are not proportion of variance explained. Limitations Logistic regression does not require multivariate normal distributions, but it does require random
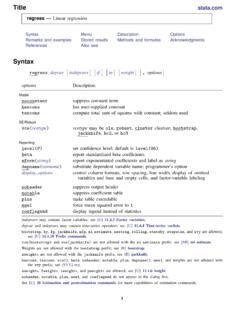
Title stata.com regress — Linear regression
www.stata.comHere is a short list of other regression commands that may be of interest. See help estimation commands for a complete list. Command Entry Description areg [R] areg an easier way to fit regressions with many dummy variables arch [TS] arch regression models with ARCH errors arima [TS] arima ARIMA models boxcox [R] boxcox Box–Cox regression models

list of some useful R functions - Columbia University
www.columbia.edu{ box.cox: Box-Cox family of transformations ("car") { boxcox: Box-Cox transformations for linear models ("MASS") Survival analysis { anova.survreg: ANOVA tables for survreg objects ("survival") { clogit: Conditional logistic regression ("survival") { cox.zph: Test the proportional hazards assumption of a Cox regression ("sur-vival")
Logistic Regression Using SPSS - Miami
sites.education.miami.eduJul 08, 2020 · aspseudo R2values (and will have lower values than in multiple regression). However, they are interpreted in the same manner, but with more caution. Therefore, the explained variation in the dependent variable based on our model ranges from 24.0% to 33.0%, depending on whether you reference the Cox & SnellR2or NagelkerkeR2methods, respectively.

Chapter 18 Estimating the Hazard Ratio What is the hazard?
www.u.arizona.eduCox regression Cox regression is a regression model that enables us to estimate the hazard ratio (hazard rate ratio) — a measure of effect which may be computed whenever the time at risk is known. The model is named after the statistician who wrote the regression equation and proposed a method to solve it (to estimate the coefficients).

An Introduction to Logistic Regression Analysis and Reporting
datajobs.comAngel, 1984; Cox & Snell, 1989; Efron, 1975; Lei & Koehly, 2000; Press & Wilson, 1978; Tabachnick & Fidell, 2001, p. 521). Logistic regression was proposed as an alter-native in the late 1960s and early 1970s (Cabrera, 1994), and it became routinely available in statistical packages in the early 1980s. Since that time, the use of logistic ...

Measures of Fit for Logistic Regression - Statistical Horizons
statisticalhorizons.comMcFadden vs. Cox-Snell . McFadden: Rationale: the log- likelihood plays a role similar to residual sum of squares in regression. A “pseudo” R -square. Problem with Cox -Snell: An upper bound less than 1. where . p is the overall proportion of events. The maximum upper bound is .75 when p=.5. When p=.9 or .1, the upper bound is only .48.

The Stratified Cox Procedure - New Jersey Institute of ...
web.njit.eduStratified Cox regression Analysis time _t: survt Stratified Cox regression Analysis time _t: survt Appendix A illustrates SC procedures using Stata, SAS, and SPSS. • Log WBC and Rx are included in SC model. • SC model is stratified by SEX. Effect of Rx adjusted for log WBC and SEX: • Hazard ratio: 2.537 = e0.931

Box-Cox Transformations
www.statvision.comThe Box-Cox Transformations procedure is designed to determine an optimal transformation for Y while fitting a linear regression model. It is useful when the variability of Y changes as a function of X. Often, an appropriate transformation of Y both stabilizes the variance and makes the deviations around the model more normally distributed.