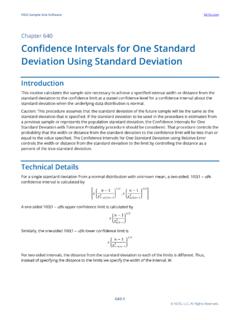
Confidence Intervals for One Standard Deviation Using ...
standard deviation to the confidence limit at a stated confidence level for a confidence interval about the standard deviation when the underlying data distribution is normal. Caution: This procedure assumes that the standard deviation of the future sample will be the same as the standard deviation that is specified.
Download Confidence Intervals for One Standard Deviation Using ...

Information
Domain:
Source:
Link to this page:
Documents from same domain

Mixed Models - Repeated Measures - Statistical …
ncss-wpengine.netdna-ssl.comMixed Models – Repeated Measures Introduction ... analysis, and the amount of data available for the analysis. When more than one fixed factor may influence the

Repeated Measures Analysis - NCSS
ncss-wpengine.netdna-ssl.comThis section provides the technical details of the repeated measures designs that can be analyzed by PASS. Earlier ... Repeated Measures Analysis ...

Chapter 469 Decomposition Forecasting - NCSS
ncss-wpengine.netdna-ssl.comChapter 469 Decomposition Forecasting Introduction Classical time series decomposition separates a time series into five components: mean, long-range trend, seasonality, cycle, and randomness. The decomposition model is Value = (Mean) x (Trend) x (Seasonality) x (Cycle) x (Random).

Chapter 575 Probit Analysis - Statistical Software
ncss-wpengine.netdna-ssl.comChapter 575 Probit Analysis Introduction Probit Analysis is a method of analyzing the relationship between a stimulus (dose) and the quantal (all or nothing) response. Quantitative responses are almost always preferred, but in many situations they are not practical. In these cases, it is only possible to determine if a certain response (such as ...

Chapter 720 Probit Analysis - Statistical Software
ncss-wpengine.netdna-ssl.comChapter 720 Probit Analysis. Introduction . Probit and logit analysis may be used for comparative LD. 50. studies for testing the efficacy of drugs designed to prevent lethality. This program module presents calculates power and sample size using the methodology outlined

Chapter 311 Stepwise Regression - Statistical Software
ncss-wpengine.netdna-ssl.comNCSS Statistical Software NCSS.com © NCSS, LLC. All Rights Reserved.

Chapter 208 Paired T-Test - NCSS
ncss-wpengine.netdna-ssl.comNCSS Statistical Software NCSS.com Paired T-Test 208-6 © NCSS, LLC. All Rights Reserved. Tests Alpha Alpha is the significance leve l used in the hypothesis tests.

Multivariate Analysis of Variance (MANOVA)
ncss-wpengine.netdna-ssl.comNCSS Statistical Software NCSS.com Multivariate Analysis of Variance (MANOVA) 415-4 © NCSS, LLC. All Rights Reserved. Assumptions and Limitations

Chapter 194 Normality Tests - NCSS
ncss-wpengine.netdna-ssl.comNCSS Statistical Software NCSS.com © NCSS, LLC. All Rights Reserved.

Distribution Weibull Fitting - NCSS
ncss-wpengine.netdna-ssl.comDistribution (Weibull) Fitting Introduction This procedure estimates the parameters of the exponential, extreme value, logistic, log-logistic, lognormal, normal, and Weibull probability distributions by maximum likelihood. It can fit complete, right censored, left censored, interval censored (readou t), and grouped data values.
Related documents
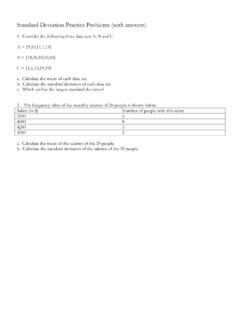
Standard Deviation Practice Problems (with answers)
mrcasalinuovo.weebly.comThe sample mean and sample standard deviation are (approximately): (a) 20 and 79.2 respectively (b) 20 and 8.9 respectively. (c) 120 and 79.2 respectively. (d) 20 and 8.2 respectively. (e) 120 and 8.9 respectively. 5. A sample of underweight babies was fed a special diet and the following weight gains (lbs) were observed at the end of three month.

Calculating the mean and standard deviation on a calculator
www.mas.ncl.ac.uksample standard deviation s; for example, press 4 (corresponding to sx for the sample standard deviation), then press = to get the answer. Note that you need to repeat the process under `for each numerical summary. You should get 15 for the mean, and 18.083 (to three decimal places) for the standard deviation; these

How$to$Calculate$Mean,$Standard$Deviation$ …
media.hhmi.orgstandard#deviationtoappear. 6.Select#the#values#that#youwant#touse#tocalculate#the#standar d deviation—the#same#ones#you#used#for#the#mean. As!you!type,!Excel!will!display! matching!functions!in!a!dropFdown! menu.!Click!“STDEV.S”!when!it! appears.!(Notethat!“STDEV.S”!is!the function!for!sample!standard! deviation.!Excel!has!another!
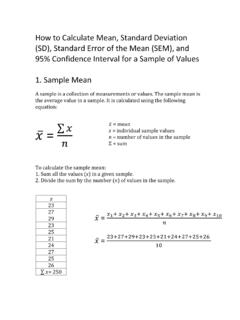
How$to$Calculate$Mean,$Standard$Deviation$ …
media.hhmi.org2. Sample$Standard$Deviation$(SD) TheSD!is!a!measure!of!thevariability!of !individualvalues!inthatsample! fromthesamplemean .!Itiscalculatedusing!thefollowing!equation :

Tests for Standard Deviations (Two or More Samples)
support.minitab.comSample Standard Deviation test in the Assistant. To do this, we needed to evaluate whether the approximated theoretical power function accurately reflects the actual power achieved by the Bonett test when it is performed on data from several types of distributions, including normal
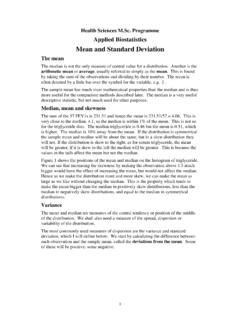
Mean and Standard Deviation - University of York
www-users.york.ac.ukstandard deviation, usually denoted by s. It is often abbreviated to SD. For the FEV data, the standard deviation = 0.449 = 0.67 litres. Figure 2 shows the relationship between mean, standard deviation and frequency distribution for FEV1. Because standard deviation is a measure of variability about the mean, this is shown

Deviation Report System Sample - GMPSOP
www.gmpsop.com2.2.2. QA has to evaluate the deviation and assess the potential impact to the product quality, validation and regulatory requirement. All DRs to be approved by QA Manager or delegate. QA manger to justify wither the deviation is a Critical, Serious or Standard. For a deviation of either critical or serious nature QA delegate has to
The Average and Standard Deviation
www.stat.berkeley.eduThe Standard Deviation (SD) The SD is a measure of how spread out numbers are around their average. Here is the recipe for calculating it: •Subtract mean from each number •Square the results •Add them up •Divide by the length of the list •Take square root of result SD is the square root of the average squared deviation from the mean 21