
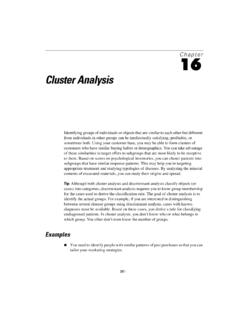
Data Preprocessing
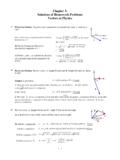
Clustering Figure 2.12A 2‐D plot of customer data with respect to customer locations in a city, showing three data clusters. Each cluster centroid is marked with a “+”, representing the average poitint on space th tthat cltluster.
Download Data Preprocessing

Information
Domain:
Source:
Link to this page:
Documents from same domain

CHAPTER Classification and Assessment of …
www.csun.eduCHAPTER Classification and Assessment of Abnormal Behavior CHAPTER OUTLINE HOW ARE ABNORMAL BEHAVIOR PATTERNS CLASSIFIED? 70–77 The DSM and Models of Abnormal Behavior STANDARDS OF ASSESSMENT 77–80 Reliability Validity Cognitive Assessment

Dissociative and Somatoform Disorders
www.csun.edu212 Chapter 7 In early versions of the DSM, dissociative and somatoform disorders were classified with the anxiety disorders under the general category of …
Chapter 3: Solutions of Homework Problems …
www.csun.edu3 – 1 Chapter 3: Solutions of Homework Problems Vectors in Physics 12. as drawn at Picture the Problem: The given vector components correspond to the vector r & right.

PRIMARY CONTENT MODULE Algebra - Linear …
www.csun.eduPRIMARY CONTENT MODULE Algebra - Linear Equations & Inequalities T-37/H-37 © 1999, CISC: Curriculum and Instruction Steering Committee The WINNING EQUATION
Chapter 8: Quantitative Sampling
www.csun.edu22 Chapter 8: Quantitative Sampling I. Introduction to Sampling a. The primary goal of sampling is to get a representative sample, or a small collection of units

th - csun.edu
www.csun.eduRunning head: APA FORMAT EXAMPLE 1 How to Do that Annoying APA Format Stuff: A Brief Overview of the 6th Edition Scott W. Plunkett California State University, Northridge

Calculations and Occupational Exposure Limits
www.csun.eduCalculations Evaluation Control 3 5 OELs • Time-weighted average (TWA) • Ceiling value (C) • Short-Term Exposure Limit (STEL) • Immediately Dangerous to Life and Health

Employee Evaluation - California State University, …
www.csun.eduPerfEval (Rev. 04/2013) Page 3 Performance Categories Rating Ethics/Fraud/Integrity Practices excellent work ethics. Properly handles confidential information.
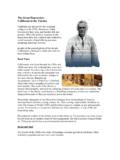
The Great Depression: California in the Thirties
www.csun.eduThe Great Depression: California in the Thirties . California was hit hard by the economic collapse of the 1930s. Businesses failed, workers lost …
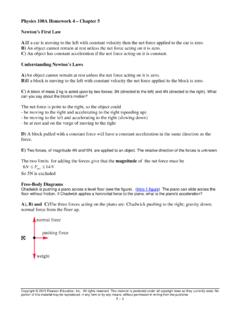
Physics 100A Homework 4 – Chapter 5 Newton’s …
www.csun.eduChapter 5: Newton’s Laws of Motion thJames S. Walker, Physics, 4 Edition C) and D) Magnitude and direction of the acceleration
Related documents
Cluster Analysis
norusis.comUsing your customer base, you may be able to form clusters of ... This can be used for market segmentation. ... In the second step, the preclusters are clustered using the hierarchical clustering algorithm. You can specify the number of clusters you want or let the algorithm decide based on preselected criteria.
Segmentation and Targeting
www.personal.psu.eduSegmentation and targeting Problems with many segmentations Markets can be segmented using many different variables, but these variables may not capture differences in response to the marketing mix; Product-specific segmentation bases are usually better indicators of differences in customer response than general segmentation bases;
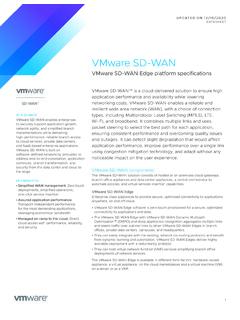
VMware SD-WAN
wan.velocloud.comDec 15, 2020 · Security AES256/128, SHA1/SHA2, IKEv2, VPNC compliant IPSec, PKI, segmentation, TLS1.2, SCEP, firewall L2-7, 1:1 NAT, port forwarding, dynamic branch to branch, MAC filtering security service Insertion capabilities: simplified service insertion of third-party NGFW VNF running

Ruckus SmartZone DATA SHEET
webresources.ruckuswireless.com3+1 active clustering increases capacity to 30K APs, 450K clients and up to 60 Gbps of aggregate throughput depending on model. Virtualize the Network · Virtual SmartZone makes possible an all-virtual data center deployment on commodity hardware minimizing capital expenses and maximizing server reuse and flexibility. Ultra-High Resliency ·

FortiWiFi 30E Data Sheet
www.fortinet.comHigh Availability Configurations Active/Active, Active/Passive, Clustering FORTIWIFI 30E Dimensions and Power Height x Width x Length (inches) 1.61 x 8.27 x 5.24 Height x Width x Length (mm) 41 x 210 x 133 Weight 2.008 lbs (0.911 kg) Form Factor Desktop Input Rating 12Vdc, 2A Power Required Powered by External DC Power Adapter, 100–240V AC ...

Analysis of Footwear Impression Evidence
www.ojp.govTo provide better customer service, NCJRS has made this Federally-funded grant final report available electronically in addition to traditional paper copies. Opinions or points of view expressed are those of the author(s) and do not necessarily reflect the official position or policies of the U.S. Department of Justice.

FortiGate 300D Data Sheet - OpenSky Technology Solutions
www.openskytech.comHigh Availability Configurations Active-Active, Active-Passive, Clustering FORTIGATE 300D Dimensions and Power Height x Width x Length (inches) 1.73 x 17 x 12.68 Height x Width x Length (mm) 44 x 432 x 322 Weight 10.5 lbs (4.8 kg) Form Factor 1 RU Power Consumption (Average / Maximum) 106 W / 194 W Power Source 100–240V AC, 60–50Hz