Transcription of Data Preprocessing
1 Data PreprocessingWeek 2To p i c sTo p i c s Data Types Data Repositories Data Preprocessing Present homework assignment #1 Team Homework Assignment #2Te a m Homework Assignment #2 Readpp227240pp250250andpp259263thetext Read pp. 227 240, pp. 250 250, and pp. 259 263 the text book. Do Examples , , , , and Exercise ,,,, Write an R program to verify your answer for Exercise Refer to pp. 453 458 of the lab book. Explore frequent pattern mining tools and play them for Exercise Preparefortheresultsofthehomeworkassignm entPrepare for the results of the homework assignment. Due date beginning of the lecture on Friday February 11th. ggyyTeam Homework Assignment #3Te a m Homework Assignment #3 Pfhdiifj Prepare for the one page description of your group project topic PrepareforpresentationusingslidesPrepare for presentation using slides Due date beginning of the lecture on Friday February 11th.
2 Figurdiscore Dataoverya Mining as a step in the proceess of knowwledge WhyDataPreprocessingIs Important?Why Data Preprocessing Is Important? Welcome to the Real World! No quality data, no quality mining results! Preprocessing is one of the most critical steps in a data mining process6 Major Tasks in Data PiPreprocessing7 Figure Forms of data preprocessingWhy Data Preprocessing is Beneficial to DMii?Data Mining? Less data data mining methods can learn fasterHi h Higher accuracy data mining methods can generalize better Simpleresults Simple results they are easier to understand Fewer attributes For the next round of data collection, saving can be made by removing redundant and irrelevant features8 Data CleaningData Cleaning9 Remarks on Data CleaningRemarks on Data Cleaning Data cleaning is one of the biggest problems in data warehousing Ralph Kimball Data cleaning is the number one problem in data warehousing DCI survey10 Why Data Is Dirty ?
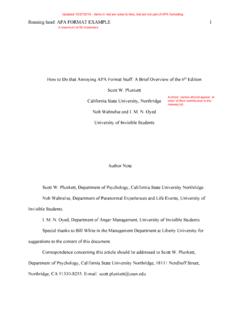
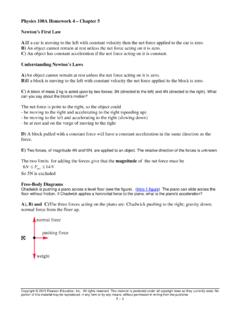
3 Ilidiid Incomplete, noisy, and inconsistent data are commonplace properties of large real world databases(p48)databases .. (p. 48) There are many possible reasons for noisy data .. (p. 48)48)11 Types of Dirty Data Cleaning MethodsTypes of Dirty Data Cleaning Methods Missing values Fill in missing values Noisy data (incorrect values) Identify outliers and smooth out noisy data 12 Methods for MissingValues (1)Methods for Missing Values (1) Ignore the tuple FillinthemissingvaluemanuallyFill in the missing value manually Use a global constant to fill in the missing value13 Methods for MissingValues (2)Methods for Missing Values (2) Use the attribute mean to fill in the missing value Use the attribute mean for all samples belonging to the same class as the given tuple Use the most probable value to fill in the missing value14 Methods forNoisy DataMethods for Noisy Data Binning Regression Clustering15 BinningBinning16 RegressionRegression17 ClusteringClusteringFigure 2 D plot of customer data with respect to customer locations in a city, showing three data clusters.
4 Each cluster centroid is marked with a + , representing the itth tltOtlibdt tdlth tflltidfaverage point on space that cluster. Outliers may be detected as values that fall outside of the sets of IntegrationData Integration19 Data IntegrationData Integration Schema integration and object matching Entity identification problem Redundant data (between attributes) occur often when integration of multiple databases Redundant attributes may be able to be detected by ltilidhith dcorrelation analysis, and chi square method20 Schema Integration and Object MatchingSchema Integration and Object Matching custom_idand cust_number Schema conflict H and S , and 1and 2for pay_typein one database Value conflict Solutionstdt(d tbtdt) meta data (data about data)21 Detecting Redundancy (1)
5 Detecting Redundancy (1) If an attributed can be derived from another attribute or a set of attributes, it may be redundant22 Detecting Redundancy (2)Detecting Redundancy (2) Some redundancies can be detected by correlation analysis Correlation coefficient for numeric data Chi square test for categorical data These can be also used for data reduction23 Chi-square TestChisquare Test For categorical (discrete) data, a correlation relationship between two attributes, A and B, can be discovered by a 2 testtest Given the degree of freedom, the value of 2 is used to decide correlation based on a significance level24 Chi-square Test for Categorical DtData =ExpectedExpectedObserved22)( Expected =crijijeo2)(2 ===ijije112 NbBcountaAcountejiij)()(= ==p.
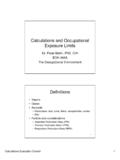
6 6825 The larger the 2value, the more likely the variables are TestChisquare 2 X 2 contingency table for the data of Example Are genderand preferred_readingcorrelated?The 2statistic tests the hypothesis that genderand preferred_readingare independent. The test is based on a significant level, with (r 1) x (c 1) degree of of Percentage Points of th 2 Di t ib ti the 2 Distribution 27 CorrelationCoefficientCorrelation Coefficient )())((11 NiiiNiiiBANbaBbAa11,====BAiBAiBANNr 11,+ BAr p. 6828 TransformationData Transformation30 Data Transformation/ConsolidationData Transformation/Consolidation Smoothing Aggregation Generalization Normaliza on Attribute construc on 31 SmoothingSmoothing Remove noise from the data Binning, regression, and clustering32 Data NormalizationData Normalization Min-max normalizationMinmax normalizationAAAAAA minnewminnewmaxnewminmaxminvv_)__('+ = z-score normalizationAAminmax AAvv =' Normalization by decimal scalingvv'=where jis the smallest integer such that 33j10where jis the smallest integer such that Max(| |)
7 < 1 Data NormalizationData Normalization Suppose that the minimum and maximum values for attribute income are $12,000 and $98,000, respectively. We would like tomapincometotherange[0 010]DoMin maxto map income to the range [ , ]. Do Minmax normalization, z score normalization, and decimal scaling for the attribute income34 Attribution ConstructionAttribution Construction NewattributesareconstructedfromgivenattributesandNew attributes are constructed from given attributes and added in order to help improve accuracy and understanding of structure in high dimension data Example Add the attribute areabased on the attributes heightand widthwidth35 Data ReductionData Reduction36 Data ReductionData Reduction Data reduction techniques can be applied to obtain a reduced representationofthedatasetthatismuchsmallerinvolumerepresentation of the data set that is much smaller in volume.
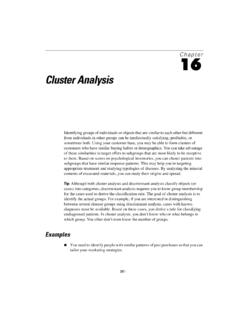
8 Yet closely maintains the integrity of the original data37 Data ReductionData Reduction (Data Cube)Aggregation Attribute (Subset) Selection Dimensionality Reduction Numerosity Reduction Data DiscretizationCtHihGti Concept Hierarchy Generation38 The Curse of Dimensionality (1)The Curse of Dimensionality (1) Size The size of a data set yielding the same density of data points in an n dimensional space increase exponentially withdimensionswith dimensions Radius A larger radius is needed to enclose a faction of the data points in a high dimensional space39 The Curse of Dimensionality (2)The Curse of Dimensionality (2) DistanceDistance Almost every point is closer to an edge than to another sample point in a high dimensional space Outlier Almost every point is an outlier in a high dimensional spacespace40 Data Cube AggregationData Cube Aggregation Summarize (aggregate) data based on dimensions The resulting data set is smaller in volume, without loss of informationnecessaryforanalysistaskinfor mation necessary for analysis task Concept hierarchies may exist for each attribute, allowing the analysis of data at multiple levels of abstraction41 Data AggregationData AggregationFigure data for a given branch of AllElectronicsfor the years 2002 to 2004.
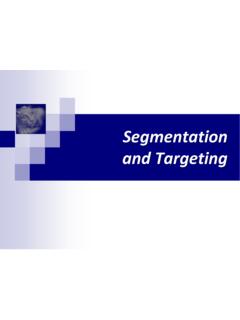
9 On the left, the sales are shown per quarter. On the right, the data are aggregated to provide the annual salesthe right, the data are aggregated to provide the annual sales42 Data CubeData Cube Provide fast access to pre computed, summarized data, therebybenefitingon lineanalyticalprocessingaswellasthereby benefiting online analytical processing as well as data mining43 Data Cube -ExampleData Cube ExampleFigure data cube for sales at AllElectronicsFigure data cube for sales at AllElectronics44 Attribute SubsetSelection (1)Attribute Subset Selection (1) Attribute selection can help in the phases of data mining (knowledge discovery) process By attribute selection, we can improve data mining performance (speed of lidi iiliifl)learning, predictive accuracy, or simplicity of rules) we can visualize the data for model selected wereducedimensionalityandremovenoise we reduce dimensionality and remove Subset Selection (2)Attribute Subset Selection (2) Attribute (Feature) selection is a search problem Search directions (Sequential) Forward selection (Sequential) Backward selection (elimination) Bidirectional selectionDiitlith(i d ti ) Decision tree algorithm (induction)46 Attribute Subset Selection (3)Attribute Subset Selection (3) Attribute (Feature)
10 Selection is a search problem Search strategiesEh tih Exhaustive search Heuristic search SelectioncriteriaSelection criteria Statistic significance Information gaing Subset Selection (4)Attribute Subset Selection (4)Figure (heuristic) methods for attribute subset selection48 DataDiscretizationData DiscretizationRdthbflfi Reduce the number of values for a given continuous attribute by dividing the range oftheattributeintointervalsof the attribute into intervals Interval labels can then be used to replace tldtlactual data values Split (top down) vs. merge (bottom up) Discretization can be performed recursively on an attribute49/51 WhyDiscretizationis Used?Why Discretizationis Used?