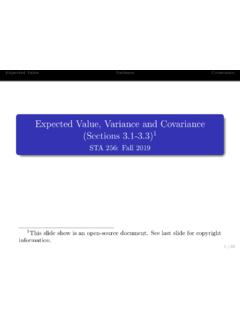
Expected Value, Variance and Covariance
De nition of Covariance Let Xand Y be jointly distributed random variables with E(X) = xand E(Y) = y. The covariance between Xand Y is Cov(X;Y) = E[(X X)(Y Y)] If values of Xthat are above average tend to go with values of Y that are above average (and below average Xtends to go with below average Y), the covariance will be positive.
Download Expected Value, Variance and Covariance
Information
Domain:
Source:
Link to this page:
Documents from same domain

SAS Example 4: Instrumental variables - University of Toronto
utstat.toronto.eduInstrumental variables on credit card data (Card1) 11 With house re-scaled (Express in tens of thousands) The CALIS Procedure Covariance Structure Analysis: Maximum Likelihood Estimation
Chapter 4 Introduction to Categorical Data Analysis Procedures
utstat.toronto.eduIntroduction to Multivariate Procedures, and PROC TRANSREG is summarized in Chapter 2, Introduction to Regression Procedures. A categorical variable is dened as …
Statistical Power Analysis for the Behavioral Sciences
utstat.toronto.eduform, by photostat, microform, retrieval system, or by any other means, without the prior written permission of the publisher. Library of Congress Cataloging-in-Publication Data Cohen, Jacob. Statistical power analysis for the behavioral sciences I Jacob Cohen. - 2nd ed. Bibliography: p. Includes index. ISBN 0-8058-0283-5 1.
Expected Value, Variance and Covariance
utstat.toronto.eduExpected ValueVarianceCovariance Conditional Expectation The idea Consider jointly distributed random variables Xand Y. For each possible value of X, there is a conditional distribution of Y. Each conditional distribution has an expected value (sub-population mean). If you could estimate E(YjX= x), it would be a good way to predict Y from X.

Multinomial Logit Models with R - University of Toronto
utstat.toronto.edu> # Estimate probabilities for a student with HSGPA = 90 > betahat1 Gone:(intercept) Passed:(intercept) Gone:hsgpa Passed:hsgpa 1.90422575 -13.39305637 -0.01881621 0.18643711

Stepwise Logistic Regression with R
utstat.toronto.eduNull deviance: 234.67 on 188 degrees of freedom Residual deviance: 234.67 on 188 degrees of freedom AIC: 236.67 Number of Fisher Scoring iterations: 4
Sampling from a Finite Population: Interval Estimation of ...
utstat.toronto.educlaim to have Internet access at home. (b) Give a 95% confidence interval for the true percentage of students who claim ... from stratum to stratum. For example, if you were interested in estimating the average hours of sports watched by students on a campus, it would be natural to stratify by sex. ...
Credit Scoring via Logistic RegressionI
utstat.toronto.eduLogistic regression is used in a wide variety of applications including biomedical studies, social science research, marketing as well as nancial applications. One example of the latter is the use of binary logistic regression models for credit-scoring, that is: modeling the probability that a …
Stepwise Logistic Regression with R
utstat.toronto.eduStepwise Logistic Regression with R ... = 2k + Deviance, where k = number of parameters Small numbers are better Penalizes models with lots of parameters Penalizes models with poor fit > fullmod = glm(low ~ age+lwt+racefac+smoke+ptl+ht+ui+ftv,family=binomial) ... > # Here was the chosen model from earlier > redmod1 = glm(low ~ lwt+racefac ...
Related documents
Data, Covariance, and Correlation Matrix
users.stat.umn.eduThe Covariance Matrix Definition Covariance Matrix from Data Matrix We can calculate the covariance matrix such as S = 1 n X0 cXc where Xc = X 1n x0= CX with x 0= ( x 1;:::; x p) denoting the vector of variable means C = In n 11n10 n denoting a centering matrix Note that the centered matrix Xc has the form Xc = 0 B B B B B @ x11 x 1 x12 x2 x1p ...
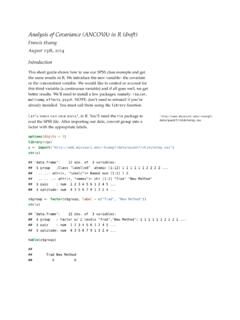
Analysis of Covariance (ANCOVA) in R (draft)
web.missouri.eduanalysis of covariance (ancova) in r (draft) 4 ## -0.779 4.779 ## sample estimates: ## mean in group Trad ## 5.67 ## mean in group New Method ## 3.67 Assumption 4: Homogeneity of variance. We’ve already discussed this before. To get this, run2: 2 Install the car package first to access the levene.test function. Including the center=mean ...
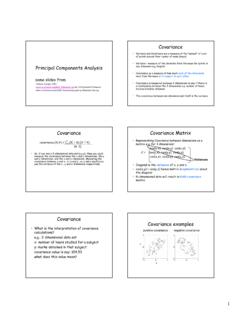
Covariance Covariance Matrix - Pennsylvania State University
www.cse.psu.edu• Covariance is measured between 2 dimensions to see if there is a relationship between the 2 dimensions e.g. number of hours studied & marks obtained. • The covariance between one dimension and itself is the variance covariance (X,Y) = i=1 (Xi – X) (Yi – Y) (n -1) • So, if you had a 3-dimensional data set (x,y,z), then you could
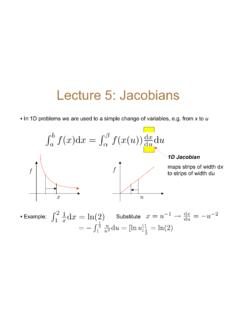
Lecture 5: Jacobians - Rice University
www.stat.rice.edu2D Jacobian • For a continuous 1-to-1 transformation from (x,y) to (u,v)• Then • Where Region (in the xy plane) maps onto region in the uv plane • Hereafter call such terms etc

Covariance and correlation - Main Concepts
www.stat.ucla.eduHowever, the covariance depends on the scale of measurement and so it is not easy to say whether a particular covariance is small or large. The problem is solved by standardize the value of covariance (divide it by ˙ X˙ Y), to get the so called coe cient of correlation ˆ XY. ˆ= cov(X;Y) ˙ X˙ Y; Always, 1 ˆ 1 cov(X;Y) = ˆ˙ X˙ Y
VICR -INVARIANCE-COVARIANCE RE GULARIZATION FOR …
arxiv.orgagreement between embedding vectors produced by encoders fed with different views of the same image. The main challenge is to prevent a collapse in which the encoders produce constant or non-informative vectors. We introduce VICReg (Variance-Invariance-Covariance Regularization), a method that explicitly avoids
Lecture 4: Joint probability distributions; covariance ...
pages.ucsd.eduThe three variance and covariance terms are often grouped together into a symmetric covariance matrix as follows: h σ2 XX σ 2 XY σ2 XY σ 2 YY i Note that the terms σ2 XX and σ 2 YY are simply the variances in the X and Y axes (the subscripts appear doubled, XX, for notational consistency). The term σ2 XY is the covariance between the two ...
198-30: Guidelines for Selecting the Covariance Structure ...
support.sas.comThere is a correlation between two separate measurements, but it is assumed that the correlation is constant regardless of how far apart the measurements are. 2 ... TYPE=covariance-structure specifies the covariance structure of G or R. TYPE=VC (variance components) is the default and it models a different variance component for ...