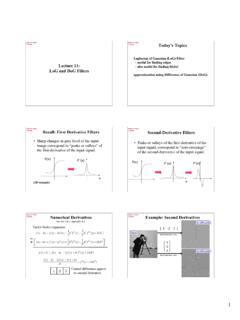
Transcription of Covariance Covariance Matrix - Pennsylvania State University
1 Covariance Variance and Covariance are a measure of the spread of a set of points around their center of mass (mean). Variance measure of the deviation from the mean for points in Principal Components Analysis one dimension heights Covariance as a measure of how much each of the dimensions vary from the mean with respect to each other. some slides from -Octavia Camps, PSU Covariance is measured between 2 dimensions to see if there is ~ tby Professor a relationship between the 2 dimensions number of hours studied & marks obtained. by Sebastian Seung. The Covariance between one dimension and itself is the variance Covariance Covariance Matrix n Representing Covariance between dimensions as a Covariance (X,Y) = i=1 (Xi X) (Yi Y). Matrix for 3 dimensions: (n -1). cov(x,x) cov(x,y) cov(x,z). So, if you had a 3-dimensional data set (x,y,z), then you could C = cov(y,x) cov(y,y) cov(y,z). measure the Covariance between the x and y dimensions, the y cov(z,x) cov(z,y) cov(z,z).
2 And z dimensions, and the x and z dimensions. Measuring the Variances Covariance between x and x , or y and y , or z and z would give you the variance of the x , y and z dimensions respectively. Diagonal is the variances of x, y and z cov(x,y) = cov(y,x) hence Matrix is symmetrical about the diagonal N-dimensional data will result in NxN Covariance Matrix Covariance Covariance examples What is the interpretation of Covariance calculations? : 2 dimensional data set x: number of hours studied for a subject Y. y: marks obtained in that subject Covariance value is say: what does this value mean? X. 1. Covariance Covariance Exact value is not as important as it's sign. Why bother with calculating Covariance A positive value of Covariance indicates both when we could just plot the 2 values to dimensions increase or decrease together as the number of hours studied increases, the marks in that see their relationship? subject increase. Covariance calculations are used to find A negative value indicates while one increases the relationships between dimensions in high other decreases, or vice-versa active social life at PSU vs performance in CS dept.
3 Dimensional data sets (usually greater than 3) where visualization is difficult. If Covariance is zero: the two dimensions are independent of each other heights of students vs the marks obtained in a subject PCA PCA Toy Example principal components analysis (PCA) is a technique that can be used to simplify a dataset It is a linear transformation that chooses a new Consider the following 3D points coordinate system for the data set such that 1 2 4 3 5 6. greatest variance by any projection of the data set comes to lie on the first axis (then called the 2 4 8 6 10 12. first principal component), 3 12 18. 6 9 15. the second greatest variance on the second axis, and so on. PCA can be used for reducing dimensionality by If each component is stored in a byte, eliminating the later principal components. we need 18 = 3 x 6 bytes PCA Toy Example PCA Toy Example Looking closer, we can see that all the points are related geometrically: they are all the same point, scaled by a 1 1 2 1 4 1.
4 Factor: 2 =1* 2 4 =2* 2 8 =4* 2. 1 1 2 1 4 1 3 3 6 3 12 3. 2 =1* 2 4 =2* 2 8 =4* 2 3 1 5 1 6 1. 3 3 6 3 12 3 6 =3* 2 10 = 5 * 2 12 = 6 * 2. 3 1 5 1 6 1 9 3 15 3 18 3. 6 =3* 2 10 = 5 * 2 12 = 6 * 2 They can be stored using only 9 bytes (50% savings!): 3 3 18 3 Store one point (3 bytes) + the multiplying constants (6 bytes). 9 15. 2. Geometrical Interpretation: Geometrical Interpretation: View each point in 3D space. Consider a new coordinate system where one of the axes is along the direction of the line: p3 p3. p2 p2. p1 p1. But in this example, all the points happen to belong to a non-zero coordinate: we In this coordinate system, every point has only one non- only need to store the direction of the line (a 3 bytes image) and the non- non- line: a 1D subspace of the original 3D space. zero coordinate for each of the points (6 bytes). Principal Component Analysis PCA. (PCA) By finding the eigenvalues and eigenvectors of the Covariance Matrix , we find that the eigenvectors with Given a set of points, how do we know the largest eigenvalues correspond to the dimensions that have the strongest correlation in the dataset.
5 If they can be compressed like in the This is the principal component. previous example? PCA is a useful statistical technique that has found The answer is to look into the application in: correlation between the points fields such as face recognition and image compression finding patterns in data of high dimension. The tool for doing this is called PCA. PCA Theorem PCA Theorem Let X be the N x n Matrix with columns Let x1 x2 xn be a set of n N x 1 vectors and let x be their x, xn x : x1 - x, x2 x, . average: Note: subtracting the mean is equivalent to translating the coordinate system to the location of the mean. 3. PCA Theorem PCA Theorem Let Q = X XT be the N x N Matrix : Theorem: Each xj can be written as: non-zero where ei are the n eigenvectors of Q with non- eigenvalues. eigenvalues. Notes: Notes: 1. The eigenvectors e1 e2 en span an eigenspace 1. Q is square 2. e1 e2 en are N x 1 orthonormal vectors (directions in 2. Q is symmetric N-Dimensional space).
6 3. Q is the Covariance Matrix [aka scatter Matrix ] 3. The scalars gji are the coordinates of xj in the space. 4. Q can be very large (in vision, N is often the number of pixels in an image!). Using PCA to Compress Data Using PCA to Compress Data Expressing x in terms of e1 en has not Sort the eigenvectors ei according to their eigenvalue: changed the size of the data However, if the points are highly correlated many of the coordinates of x will be zero or Assuming that closed to zero. Then note: this means they lie in a lower-dimensional linear subspace lower- PCA Example STEP 1 PCA Example STEP 2. ~edelman/Psych-465-Spring-2003 Calculate the Covariance Matrix DATA: cov = .616555556 .615444444. x y .615444444 .716555556.. mean this becomes the since the non-diagonal elements in this new origin of the Covariance Matrix are positive, we should 2 1 data from now on expect that both the x and y variable .. increase together. 4. PCA Example STEP 3. PCA Example STEP 3.
7 Eigenvectors are plotted as diagonal dotted lines Calculate the eigenvectors and eigenvalues on the plot. Note they are of the Covariance Matrix perpendicular to each other. eigenvalues = .0490833989 Note one of the eigenvectors goes through the middle of the points, eigenvectors = like drawing a line of best fit..677873399 -735178656 The second eigenvector gives us the other, less important, pattern in the data, that all the points follow the main line, but are off to the side of the main line by some amount. PCA Example STEP 4 PCA Example STEP 5. Feature Vector Deriving new data coordinates FeatureVector = (eig1 eig2 eig3 eign). FinalData = RowFeatureVector x RowZeroMeanData We can either form a feature vector with both of the eigenvectors: RowFeatureVector is the Matrix with the eigenvectors in the columns transposed so that the eigenvectors are now in the rows, with the most .677873399 significant eigenvector at the top or, we can choose to leave out the smaller, less RowZeroMeanData is the mean-adjusted data significant component and only have a single column: transposed, ie.
8 The data items are in each - .677873399. column, with each row holding a separate - .735178656 dimension. Note: his is essential Rotating the coordinate axes higher-variance axes come first. so higher- PCA Example STEP 5 PCA Example : Approximation If we reduced the dimensionality, obviously, when reconstructing the data we would lose those dimensions we chose to discard. In our example let us assume that we considered only the x dimension . 5. PCA Example : Final Approximation Another way of thinking about Principal component direction of maximum variance in the input space happens to be same as the principal eigenvector of the Covariance Matrix 2D point cloud Approximation using one eigenvector basis One-dimensional projection Covariance to variance From the Covariance , the variance of any projection can be calculated. Let w be a unit vector wT x . 2 2. wT x wT Cw wi Cij w j find projection that maximizes variance ij Maximizing variance Implementing PCA.
9 Principal eigenvector of C Need to find first k eigenvectors of Q: the one with the largest eigenvalue. w* argmax wT Cw w: w 1. max C max wT Cw Q is N x N (Again, N could be the number of pixels in w: w 1. an image. For a 256 x 256 image, N = 65536 !!). w*T Cw* Don't want to explicitly compute Q!!!! Don'. 6. SVD Properties Singular Value Decomposition (SVD). Any m x n Matrix X can be written as the product of 3. matrices: The columns of U are the eigenvectors of XXT. The columns of V are the eigenvectors of XTX. Where: The squares of the diagonal elements of D are the U is m x m and its columns are orthonormal vectors V is n x n and its columns are orthonormal vectors eigenvalues of XXT and XTX. D is m x n diagonal and its diagonal elements are called the singular values of X, and are such that: 1 2 n 0. 7.