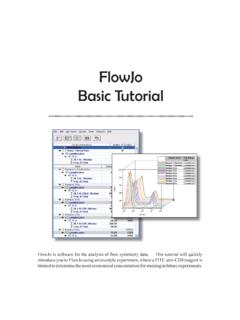
FlowJo Basic Tutorial - flowlab-childrens-harvard.com
Drag to draw a gate to set the range of fluorescence values that will define FL1 positive cells. Name this subset FL1+. Click the plus sign to add the name to the list for future use. Click OK. There are several gating tools for bivariate plots. Rectangle, Polygon, Quadrant or Ellipse gating tools can be selected from the top of the Graph
Download FlowJo Basic Tutorial - flowlab-childrens-harvard.com

Information
Domain:
Source:
Link to this page:
Related documents
An Introduction to Fluorescence Spectroscopy
www.chem.uci.edufluorescence always takes place from the lowest vibrational level of the first excited state, the shape of the emission spectrum is always the same, despite changing the wavelength of exciting light. A plot of emission against wavelength for any given excitation wavelength is

Fluorescence Quenching - UZH
www.chem.uzh.chPhysikalisch-chemisches Praktikum I Fluorescence Quenching { 2016 Fluorescence Quenching Summary The emission of light from the excited state of a molecule (uorescence or phospho-rescence) can be quenched by interaction with another molecule. The stationary and time-dependent observation of such processes reveals insight into the deactiva-

1 Basic Principles of Fluorescence Spectroscopy - Wiley-VCH
application.wiley-vch.de1 Basic Principles of Fluorescence Spectroscopy 1.1 Absorption and Emission of Light As fluorophores play the central role in fluorescence spectroscopy and imaging we
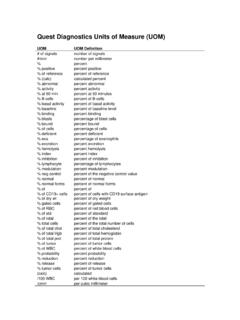
Quest Diagnostics Units of Measure (UOM)
www.questdiagnostics.commean intensity fluorescence units . Million/mL : million per microliter . min : minute . mL : milliliter . mL/24 h : milliliter per 24 hours . mL/min : per minute . milliliter mL/min/1.73m2 : nute per 1.73 meters squared . milliliter per mi mm : millimeter . mm/h : millimeter per hour . mm/Hg : millimeters of mercury . mm2/mm3 : per cubic ...