
graph twoway scatter — Twoway scatterplots plottypes, …
6graph twoway scatter— Twoway scatterplots axis choice options are for use when you have multiple x or y axes. See[G-3] axis choice options for more information.twoway options include added line options, which specify that horizontal or vertical lines be drawn on the graph; see
Download graph twoway scatter — Twoway scatterplots plottypes, …

Information
Domain:
Source:
Link to this page:
Documents from same domain

Syntax - Stata
www.stata.com2cluster kmeans and kmedians— Kmeans and kmedians cluster analysis Options Main k(#) is required and indicates that # groups are to be formed by the cluster analysis.

Syntax Description - Stata
www.stata.com2substr()— Extract substring Diagnostics In substr(s, b, l) and substr(s, b), if b describes a position before the beginning of the string or after the end, "" is returned.

Title stata.com generate — Create or change …
www.stata.comTitle stata.com generate — Create or change contents of variable SyntaxMenuDescriptionOptions Remarks and examplesMethods and formulasReferencesAlso see Syntax Create new variable generate type newvar

SyntaxDescriptionRemarks and examplesAlso see
www.stata.commacro— Macro definition and manipulation 3 Macro extended functions related to matrices rownamesjcolnamesjrowfullnamesjcolfullnames matname roweqjcoleq

Title stata.com graph box — Box plots
www.stata.comgraph box— Box plots 3 Menu Graphics > Box plot Syntax graph box yvars if in weight, options graph hbox yvars if in weight, options where yvars is a varlist options Description

Title stata
www.stata.comarea options — Options for specifying the look of special areas 3 Also see [G-2] graph dot — Dot charts (summary statistics)

www.stata.com
www.stata.com2cluster dendrogram— Dendrograms for hierarchical cluster analysis The height of the vertical lines and the range of the (dis)similarity axis give visual clues about the

Title stata.com putexcel — Export results to an Excel …
www.stata.computexcel— Export results to an Excel file 3 export options Description Main overwritefmt overwrite existing cell formatting when exporting new content

destring — Convert string variables to numeric ... - …
www.stata.comTitle stata.com destring — Convert string variables to numeric variables and vice versa SyntaxMenuDescription Options for destringOptions for tostringRemarks and …

Title stata.com gettoken — Low-level parsing
www.stata.comTitle stata.com gettoken — Low-level parsing SyntaxDescriptionOptionsRemarks and examplesAlso see Syntax gettoken emname1 emname2: emname3, parse("pchars") quotes qed(lmacname) match(lmacname) bind
Related documents
Dealing with missing data: Key assumptions and methods …
www.bu.eduwith 1,000 people and 20 variables. Each of the variables has missing data on 5% of the cases, then, you could expect to have complete data for only about 360 individuals, discarding the other 640. It works well when the data are missing completely at random (MCAR), which rarely happens in reality (Nakai & Weiming, 2011). 4.1.2.

Part 2: Analysis of Relationship Between Two Variables
www.ess.uci.eduA value of 0.7654 means that 76.54% of the variance in y can be explained by the changes in X. The remaining 23.46% of the variation in y is presumed to be due to random variability. ESS210B Prof. Jin-Yi Yu Significance of the Regression Coefficients ... regression in the analysis of two variables is like the relation between the standard ...

Chapter two: Precipitation - GitHub Pages
mgebrekiros.github.ioset of data. Specifically, given a set of measurements on two random variables, y and x, regression provides a means for finding the values of the coefficients a and b for the straight line (y = a+ bx) that best fits the data. The coefficients a and b can be found using least square method using the following two equations simultaneously
UNDERSTANDING ANALYSIS OF COVARIANCE (ANCOVA)
oak.ucc.nau.edustated, whether the adjusted group means differ significantly from each other. With a one-way analysis of covariance, each individual or case must have scores on three variables: a factor or independent variable, a covariate, and a dependent variable. The factor divides individuals into two or more groups or levels, while

AP Statistics Chapter 6 Discrete, Binomial & Geometric ...
www.danshuster.comMean (expected value) of a Binomial Random Variable Formula: P np Meaning: Expected number of successes in n trials (think average) Example: Suppose you are a 80% free throw shooter. You are going to shoot 4 free throws. For n = 4, p = .8, P (4)(.8) 3.2, which means we expect 3.2 makes out of 4 shots, on average
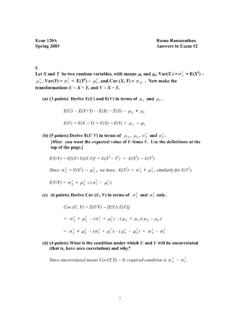
X Y be two random variables, with means µ and Var(X ) = = …
econweb.ucsd.eduX and Y are random variables with means µ x and µ y, variances , and covariance 2 and 2 σX σY σXY, all fixed constants. Consider the new random variable U = (Y − µ Y) − b(X−µx), where b is a fixed constant that I choose. It follows that U2 = (Y − µ Y) 2 − 2b(X−µx)(Y − µ Y) + b 2(X−µ x) 2. [Hint: Do not expand this ...
Chapter 206 Two-Sample T-Test
ncss-wpengine.netdna-ssl.comThe typical comparison of two distributions is the comparison of means. If we can safely make the assumption of the data in each group following a normal distribution, we can use a two-sample t-test to compare the means of random samples drawn from these two populations. If these assumptions are severely violated, the nonparametric
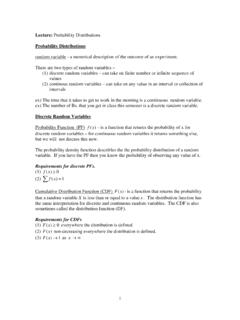
Lecture: Probability Distributions
www.ssc.wisc.eduThere are two types of random variables – (1) discrete random variables – can take on finite number or infinite sequence of values (2) continous random variables – can take on any value in an interval or collection of intervals ex) The time that it takes to get to work in the morning is a continuous random variable.
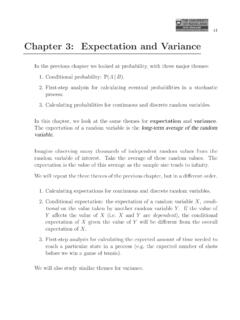
Chapter 3: Expectation and Variance
www.stat.auckland.ac.nz3. Calculating probabilities for continuous and discrete random variables. In this chapter, we look at the same themes for expectation and variance. The expectation of a random variable is the long-term average of the random variable. Imagine observing many thousands of independent random values from the random variable of interest.