GROUNDNUT
Jul 06, 2002 · production price of groundnut in India is competitive globally. The market price is only 16 percent above the producer price. Except for India and United States of America the price ratio is above 40 percent in the leading exporting countries (Rama Rao et al.
Download GROUNDNUT

Information
Domain:
Source:
Link to this page:
Documents from same domain

Forest and landscape restoration
www.fao.orgForest and landscape restoration An international journal of forestry and forest industries Vol. 66 2015/3 245 ISSN 0041-6436

i1379e - Good Practices for the Feed Industry ...
www.fao.orgFOOD AND AGRICULTURE ORGANIZATION OF THE UNITED NATIONS Rome, 2010 FAO ANIMAL PRODUCTION AND HEALTH 9 manual GOOD PRACTICES FOR THE FEED INDUSTRY Implementing the Codex Alimentarius

Adoption of Climate-Smart Agricultural Practices: …
www.fao.org1 Adoption of Climate-Smart Agricultural Practices: Barriers, Incentives, Benefits and Lessons Learnt from the MICCA Pilot Site in Kenya FINAL REPORT

Ethiopia Climate-Smart Agriculture Scoping Study
www.fao.orgFOOD AND AGRICULTURE ORGANIZATION OF THE UNITED NATIONS Addis Ababa 2016 ETHIOPIA CLIMATE-SMART AGRICULTURE SCOPING STUDY Melaku Jirata, Sebastian Grey and Edward Kilawe

Climate-Smart Agriculture Sourcebook
www.fao.orgClimate-Smart Agriculture Sourcebook Summary Second Edition Food and Agriculture Organization of the United Nations Rome, 2017

FAO Statistical Pocketbook 2015 World Food and …
www.fao.orgFAO Statistical Pocketbook 2015 Food and Agriculture Organization of the United Nations, Rome, 2015

SOLOMON ISLANDS FORESTRY OUTLOOK STUDY
www.fao.orgasia-pacific forestry sector outlook study ii working paper series working paper no. apfsos ii/wp/2009/31 solomon islands forestry outlook study1 by

Landgrabordevelopment opportunity?
www.fao.orgLandgrabordevelopment opportunity? Agricultural investment and international land deals in Africa Enabling poor rural people to overcome poverty Lorenzo Cotula, Sonja …

The State of Food Insecurity in the World
www.fao.org2015 The State of Food Insecurity in the World Meeting the 2015 international hunger targets: taking stock of uneven progress

STATE OF THE WORLD’S FORESTS
www.fao.orgforests and agriculture: land-use challenges and opportunities state of the world’s forests 2016 state of the world’s forests 2016 fao
Related documents
Part 1, chapter 2. Agriculture in Sub-Saharan Africa ...
www.fao.orgheavily influence economic development in most countries in Sub-Saharan Africa. From 1990 to 2013, the total value of agricultural production, measured in constant US dollars, increased by 130% (Figure 2.2). The crop sector dominates total agricultural production value, accounting on average for almost 85% of total production value over the
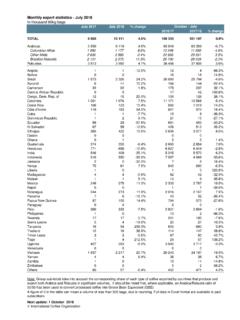
Monthly export statistics (Members & Non-Members ...
www.ico.orgTOTAL 9 600 10 149 5.7% 18 973 20 203 6.5% Arabicas 5 896 6 840 16.0% 12 242 13 538 10.6% ... Note: Group sub-totals take into account the corresponding share of each type of coffee exported by countries that produce and export both Arabica and Robusta in significant volumes.€€It should be noted that, where applicable, an Arabica/Robusta ...
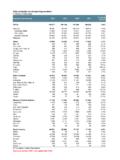
Table 1: Crop year production by country* In thousand 60 ...
www.ico.orgTable 2: Coffee year production by country ... 2018-19 TOTAL 160 713 166 476 173 088 168 836 -2.5% Arabicas 100 686 97 478 101 083 96 054 -5.0% Colombian Milds 15 944 15 148 15 483 15 524 0.3% Other Milds 30 627 31 763 31 927 30 841 -3.4% Brazilian Naturals 54 115 50 567 53 674 49 688 -7.4%
Lecture 2a: Ricardian Model part 1
are.berkeley.eduProduction possibility frontier: • Also a line • Just need two points: • If all workers were employed in wheat they could produce 100 bushels. • If all workers were employed in cloth they could produce 100 yards. 2 Ricardian Model Setup

Economics 181: International Trade Midterm Solutions
eml.berkeley.edu(a) All countries would be better off (b) The terms of trade of cloth exporters improve (c) The terms of trade of food exporters improve (d) The terms of trade of all countries improve (e) None of the above Answer: B. In the standard trade model, terms of trade are defined by: TOT = P X P M. Therefore, for countries with P X P M = Pc P f
Chapter 12. International trade, standards and regulations ...
unece.orgin different countries. With the growth of international trade these differences have become a real problem for the manufacturing industries, especially in the major exporting countries. On the other hand, local industries quickly realized that these differences might protect them from competitive imports and therefore supported it.

Country Analysis Executive Summary: Ecuador
www.eia.govSep 17, 2021 · Ecuador withdrew its membership from the Organization of the Petroleum Exporting Countries (OPEC) effective January 1, 2020. According to Ecuador’s government, the country’s ... production Figure 2. Ecuador' total petroleum and other liquids production and consumption (2010-2020) 4 destinations for Ecuador’s crude oil. Ecuador was the ...
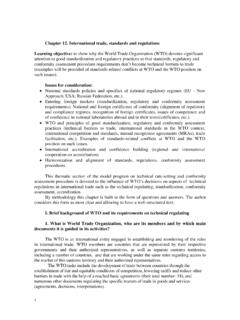
Country Analysis Brief: Egypt
www.eia.govMay 24, 2018 · all these estimates qualify Egypt as the largest holder of oil refining capacity in Africa. A bottom-up approach of estimating total refining capacity by calculating the topping capacity of each of Egypt’s refineries results in a capacity of 721,500 b/d, as illustrated in …
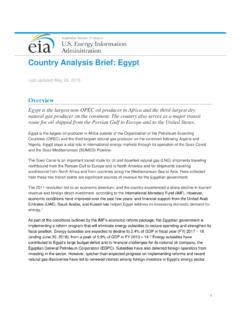
Global Market Report: Soybeans
www.iisd.orgThe top three countries together accounted for 80%53 of total production in 2017 and dominated world exports. This cultivation requires large landmasses: in 2017, soybeans were cultivated on 131 million hectares, primarily in a small number of large-scale private plantations in the leading growing countries. Estimates