
Lesson 15: Bode Plots of Transfer Functions
Bode plots of transfer functions give the frequency response of a control system To compute the points for a Bode Plot: 1) Replace Laplace variable, s, in transfer function with jw 2) Select frequencies of interest in rad/sec (w=2pf) 3) Compute magnitude and …
Download Lesson 15: Bode Plots of Transfer Functions
Information
Domain:
Source:
Link to this page:
Documents from same domain
ELECTRIC CIRCUITS LABORATORY MANUAL - …
www.engr.siu.eduELECTRIC CIRCUITS LABORATORY MANUAL ... not copy or repeat the procedure description from the lab manual. ... 4- Measure the voltage value using the digital ...
CHAPTER 1 THE SAFETY AND HEALTH MANAGER
www.engr.siu.edu2004 Safety Lecture Notes Page 1 CHAPTER 1 THE SAFETY AND HEALTH MANAGER Everyone wants a safe and healthful workplace, but what each person is willing to do to ... committed for named target areas such as construction. Recordkeeping Forms . the safety and health manager.
Lesson 11: Transformer Name Plate Data and Connections
www.engr.siu.edu3/2/2018 1 LESSON 11: TRANSFORMER NAME PLATE DATA AND CONNECTIONS ET 332b Ac Motors, Generators and Power Systems 1 Lesson 11_et332b.pptx LEARNING OBJECTIVES

Lesson 11: Transformer Name Plate Data and Connections
www.engr.siu.eduDot Notation - Terminals marked with a dot are considered instantaneously positive A B E AB + - + - N 1 N 2 I 1 I 2 0 degree shift C D Above Terminals A and C are positive at the same time E AB E CD 0 degrees Phasor Diagram TRANSFORMER MARKINGS AND POLARITY Lesson 11_et332b.pptx 4 A B + - E AB I 2 180 degree shift C D + -
ELECTRIC CIRCUITS LABORATORY MANUAL
www.engr.siu.eduTardy students may not be allowed to perform the experiment. 2. Laboratory teams: The class will be divided in teams of three or four students. The composition of the teams (which students will team up) is left to the preference of the students, but the lab instructor makes the

Lesson 15: Induction Motor Testing: Lock-Rotor and No-load ...
www.engr.siu.eduLock-rotor No-load DC Test V line = 36.2 V 460.0 V V dc = 12.0 V I line = 58.0 A 32.7 A I dc = 59.0 A P T = 2573.4 W P T = 4664.4 W Example 15-1 Solution (1) Lesson 15_et332b.pptx 10 Convert line voltages, currents and total power to per phase quantities
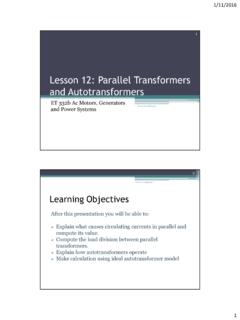
Lesson 12: Parallel Transformers and Autotransformers
www.engr.siu.eduLesson 12_et332b.pptx 20 Autotransformer action can be obtained by proper connection of two winding transformer coils N 2 N 1 V HS Load For step-down mode LS 2 HS 1 2 N N N N N LS HS 2 1 2 LS HS V V N N N N N a Where: N1 = number of turns in primary (HV) N2 = number of turns in secondary (LV)
Lesson 9: Practical Transformer Model and Calculations
www.engr.siu.eduTypical values: 3-5% of rated for large power transformers. Transformer Voltage Drop and Impedance Lesson 9_et332b.pptx 18 Example 9-2: The equivalent resistance and reactance of a 50 kVA, 2400-480 V transformer's windings are R = 2.80 W and X = 6.00 W. (high side). A load of 10 20o is connected to the low voltage side. Determine:
Lesson 14: Transfer Functions of Dc Motors
www.engr.siu.edu10/28/2015 5 EXAMPLE 14-1 SOLUTION (2) 9 x c) Find maximum back emf Answer d) Find no-load motor speed At no-load, T=0. Load torque is zero. T=0 TRANSFER FUNCTION OF ARMATURE- CONTROLLED DC MOTOR 10 x Write all variables as time functions
CHARACTERISTICS OF PULSE AND SQUARE WAVES
www.engr.siu.eduT ime A m p l i t u d e Definition : Pulse width, t p, is the time difference between the 50% amplitudes of the rising and falling edges. A A/2 t p t 1 t 2 Pulse Characteristics Positive and Negative Pulses Positive pulses increase from baseline voltage T ime A m p l i t u d e V baseline =0 V baseline >0
Related documents
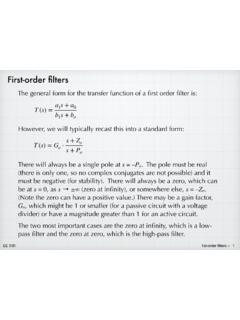
First-order filters - Iowa State University
tuttle.merc.iastate.edupass response, except that pass-band is above the cut-off frequency in this case. Once again, we see the importance of the poles in determining the behavior of the transfer functions. ω c = P o We can calculate the phase at the cut-off frequency. θ HP = 90 ∘ −arctan (ω c P o) = 45∘ Use the standard definition for cut-off frequency ...
Convolution, Correlation, Fourier Transforms
ugastro.berkeley.eduThe Response Function • The effect of convolution is to smear the signal s(t) in time according to the recipe provided by the response function r(t) • A spike or delta-function of unit area in s which occurs at some time t 0 is – Smeared into the shape of the response function – Translated from time 0 to time t 0 as r(t - t 0)
ECE 380: Control Systems - Purdue University College of ...
engineering.purdue.eduand produces outputs in response. Systems are often composed of smaller com-ponents that are interconnected together, leading to behavior that is more than just the sum of its parts. In the control literature, systems are also commonly referred to as plants or processes. System Input Output Figure 1.1: An abstract representation of a system.
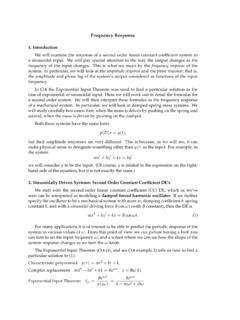
Frequency Response - MIT Mathematics
math.mit.eduFrequency Response 5 Note that the gain is a function of w, i.e. g = g(w).Similarly, the phase lag f = f(w) is a function of w.The entire story of the steady state system response xp = Acos(wt f) to sinusoidal input signals is encoded in these two functions of w, the gain and the phase lag.
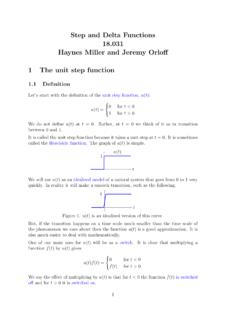
Step and Delta Functions Haynes Miller and Jeremy Orlo 1 ...
math.mit.eduProof. This is a triviality since in the frequency domain: output = transfer function input. Example 1. Consider the system _x+2x= f(t), with input fand response x. Find the unit step response. answer: We have f(t) = u(t) and rest initial conditions. The system function is 1=(s+ 2), so by the theorem, the unit step response written in terms of ...
Chapter 8 Frequency Modulation (FM) Contents
user.eng.umd.eduwhere ∆f is the peak frequency deviation and fm is the maximum baseband message frequency component. Example Commercial FM signals use a peak frequency deviation of ∆f = 75 kHz and a maximum baseband message frequency of fm = 15 kHz. Carson’s rule estimates the FM signal bandwidth as BT = 2(75+15) = 180 kHz which is six times
Transfer Functions
www.cds.caltech.edu92 CHAPTER 6. TRANSFER FUNCTIONS Frequency response was one of the key ideas that formed the foundation of control. The response of linear systems to sinusoids was discussed in Section 2.3, see Equation (2.22). Consider a linear input/output system dny dtn +a1 dn¡1y dtn¡1 +:::+any= b1 dn¡1u dtn¡1 +b2 dn¡2u dtn¡2 +:::+bnu; (6.1)